Figure 3.

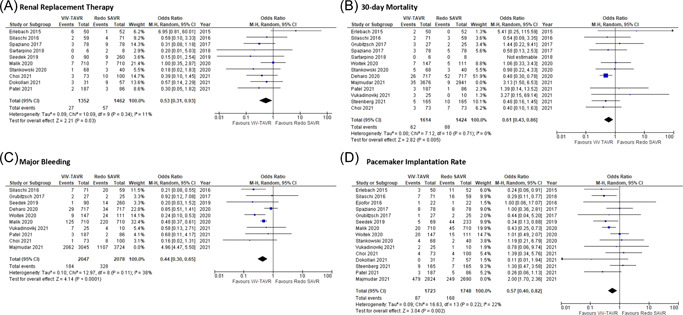
Sensitivity analysis Forrest plots. Pooled odds ratio and conclusions plot for (A) renal replacement therapy, (B) 30‐day mortality, (C) major bleeding, and (D) pacemaker implantation.

Sensitivity analysis Forrest plots. Pooled odds ratio and conclusions plot for (A) renal replacement therapy, (B) 30‐day mortality, (C) major bleeding, and (D) pacemaker implantation.