
FIGURE 2.
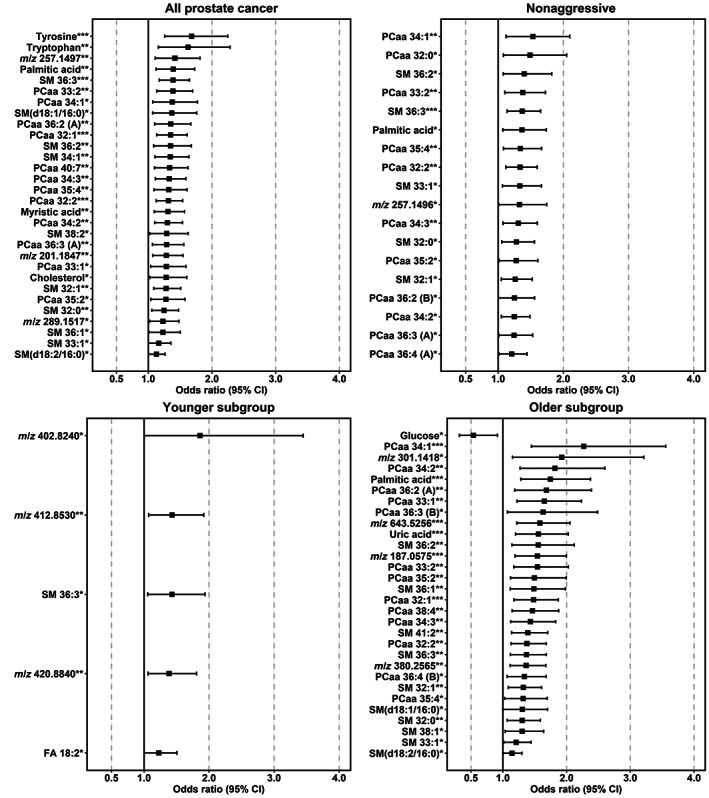
Odds ratios for prostate cancer (PCa) risk by log2 of metabolite feature signal intensities. The odds ratios and 95% confidence intervals (CIs) are derived from a conditional logistic regression, *P < .05, **P < .01, ***P < .001. The metabolites presented also showed variable importance on projection (VIP) ≥1.5 and VIP 95% CI >0 in orthogonal projection of latent structures‐effect projections (OPLS‐EP) models, and/or statistical significance (P < .05) after Bonferroni correction in a two‐sided Wilcoxon signed‐rank test. Adjustment for age, body mass index, smoking status, and alcohol consumption did not significantly affect the odds ratio. Upper left panel: results for all 752 matched case‐control pairs (overall), upper right panel: results for the nonaggressive subset (587 pairs), lower left panel: results for the younger subset (326 pairs) with a baseline age of 40 and 50 years, and lower right panel: results for the older subset (426 pairs) with a baseline age of 60 years. Two unannotated features (m/z 216.9227**), odds ratio (confidence interval) 5.49 (1.56‐19.3) and m/z 206.8938*, 3.13 (1.23‐7.96) were excluded from the younger subgroup plot, due to large CI (for details, see Table S6). Note the linear x‐axis. FA, fatty acid; PCaa, diacyl‐phosphatidylcholine; SM, sphingomyelin.