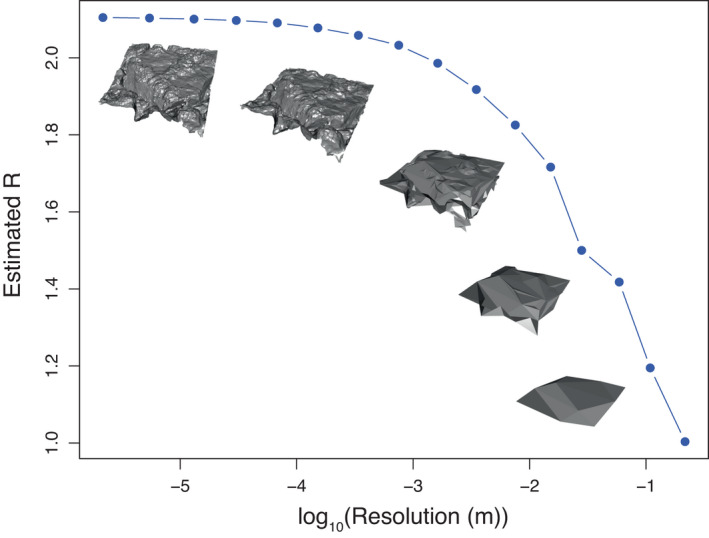
FIGURE 6.

Illustration of how estimated rugosity of a 1 m × 1 m rocky shore DEM changes with decreasing resolution (or increasing granularity). Since the planar area was 1 m2, effectively represents total available surface area at a given resolution in square metres.
