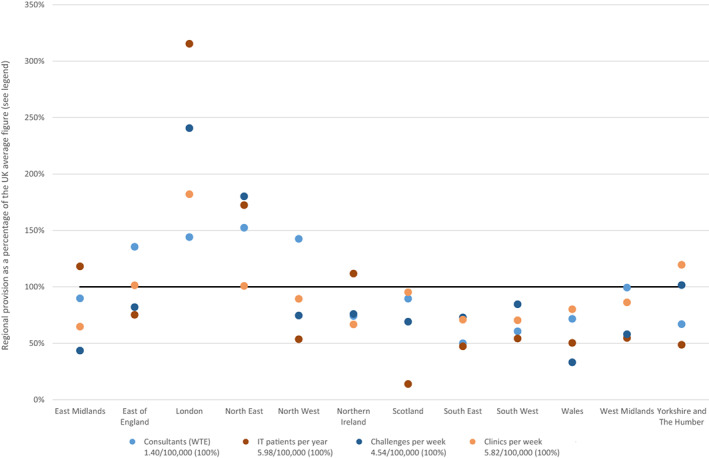
FIGURE 3.

Regional differences in paediatric allergy services. Data shown are the regional differences in four metrics: (1) The average number of consultants (WTE) providing paediatric allergy services (Light blue), (2) New immunotherapy patients per year (Red), (3) Challenges undertaken per week (Navy) and (4) Paediatric allergy clinics undertaken per week (Yellow) The provision of each metric per 100,000 children (0–17 years) in the United Kingdom is shown in the legends. For each region the provision per 100,000 children in that region was calculated and this is shown as a percentage of the UK figure. For example, there are 208 WTE consultants proving paediatric allergy services in the United Kingdom to 14,908,442 children. This equates to 1.40 WTE consultants per 100,000 children (the UK average). East Midlands has 13.3 WTE consultants for 1,060,868 children, that is, 1.25 per 1000,000 children. This is 90% of the UK average figure and hence is plotted at 90%.
