FIGURE 8.

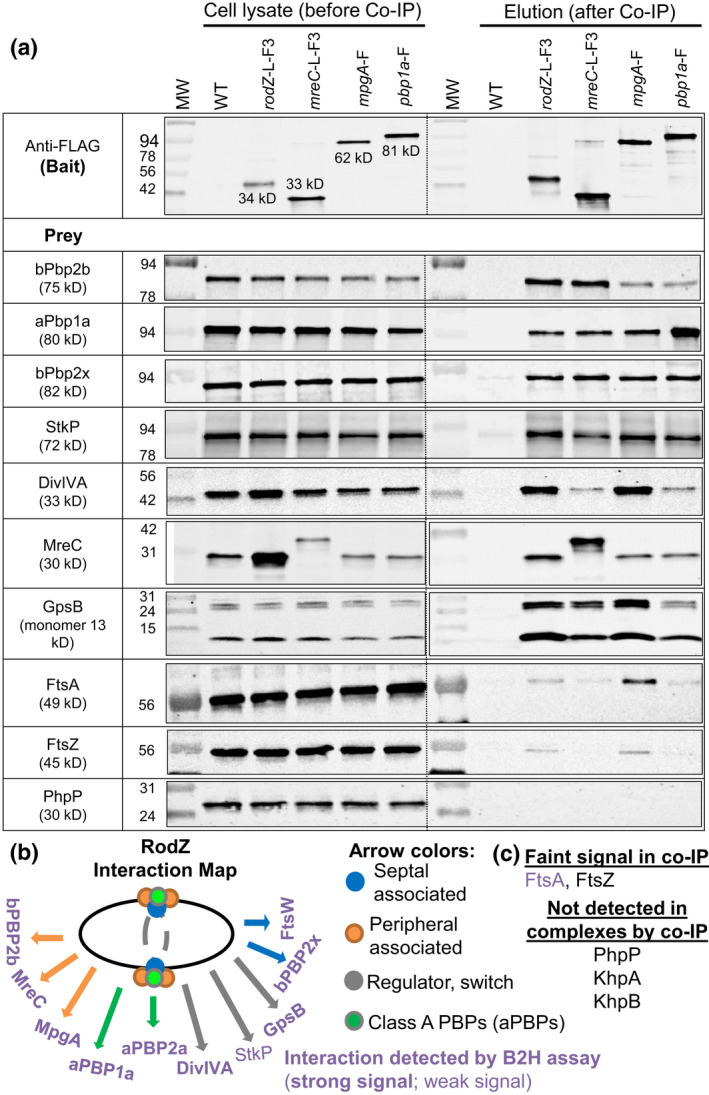
RodZ, MreC, MpgA (formerly MltG), and aPbp1a are in complexes with components of the peripheral and septal PG machines, class a PBPs, and cellular regulators StkP, GpsB, and DivIVA. Co‐IP experiments using non‐FLAG‐tagged WT strain (IU1945) or FLAG‐tagged strains RodZ‐L‐F3 (IU6291), MreC‐L‐F3 (IU4970), MpgA‐F (IU7403), or PBP1a‐F (IU5840) as bait were probed with native antibodies to detect prey proteins bPBP2b, aPBP1a, bPBP2x, StkP, DivIVA, MreC, GpsB, FtsA, FtsZ and PhpP as described in Experimental procedures. Prey proteins were detected in all cell lysates (input; left lanes). In elution output samples (right lanes), prey proteins are undetectable for the WT non‐FLAG‐tagged control strain but are present in different relative amounts in samples of the FLAG‐tagged strains. The top blot was probed with anti‐FLAG primary antibody for detection bait proteins. For most blots, 4 μl (4–6 μg) of each lysate sample (input) were loaded on the left lanes, while 15 μl of each elution output sample (after mixing 1:1 2× Laemmli buffer) were loaded on the right lanes. For detection of GpsB, 6 μl (6 μg) of lysate sample and 25 μl of output were loaded. Two bands are detected with anti‐GpsB antibody in the input and output samples, possibly due to failure of heating to reverse cross‐linking of GpsB monomers. The bottom band corresponds to GpsB monomer (≈13 kDa), whereas the top band is likely a GpsB dimer (≈26 kDa). Bands detected with anti‐MreC or anti‐aPBP1a in MreC‐L‐F3 or Pbp1a‐F strains were F‐tagged bait proteins. For detection of MreC‐L‐F3 or Pbp1a‐F in output elution samples, 3 μl of samples were loaded to each lane. The relative amount of MreC was 5–9‐fold higher in the input lysate of rodZ‐L‐F3‐Pc erm (IU4970; MreC row) compared with that from the untagged WT strain (shown in adjacent lane) or lysate obtained from the markerless rodZ‐F strain (IU14594, data not shown), suggesting that the Pc promoter present in the rodZ‐L‐F3‐Pc erm construct leads to overexpression of downstream genes, including mreC. Nevertheless, the Co‐IP results using the rodZ‐F markerless strain lacking an antibiotic‐resistance cassette (IU14594) were similar to those for the rodZ‐L‐F3‐Pc‐ erm strain (IU4970) (data not shown). Co‐IP experiments were performed 2–6 times with similar results (see Table 3 for quantitation). (b) Interaction map of RodZ in cells detected by co‐IP. (c) Proteins that were weakly or not detected in complex with RodZ by co‐IP.
