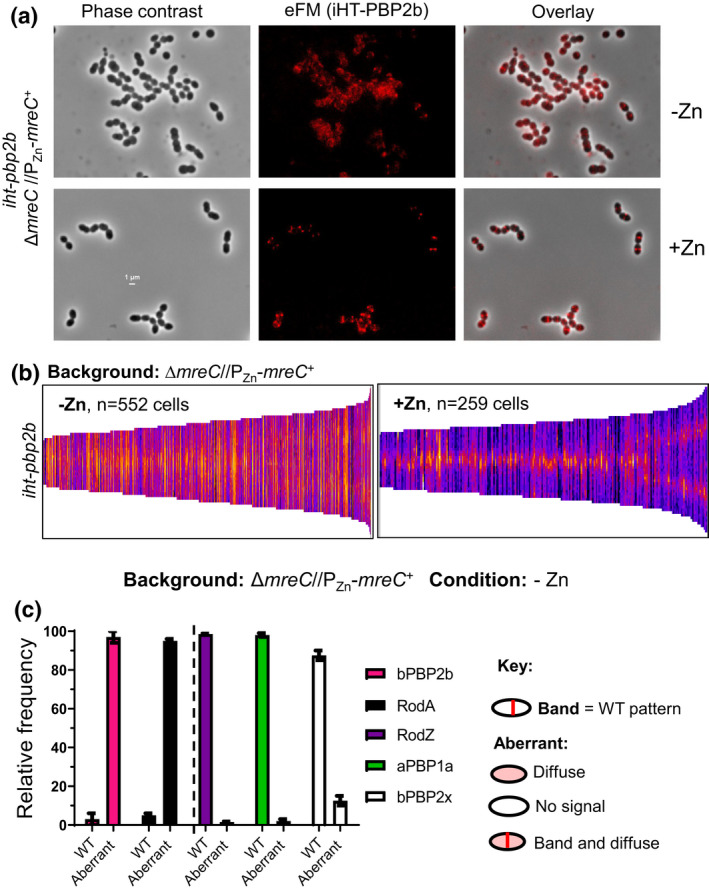
FIGURE 13.

Depletion of MreC leads to mislocalization of bPBP2b and RodA, but not RodZ. For localization of bPBP2b, IU16281 (iht‐pbp2b ΔmreC //PZn ‐mreC +) was grown overnight in the presence of Zn inducer (0.4 mMCl2 Zn + 0.04 mM MnSO4) and diluted into fresh medium containing (complementation) or lacking (depletion) Zn inducer to OD620 ≈ 0.003. After 4 h, iHT‐PBP2b was labeled with a saturating concentration of a HT‐TMR ligand, and localized in cells by 2D epifluorescence microscopy (eFM) as described in Experimental procedures. (a) Representative micrographs of iHT‐PBP2b localization under MreC complementation or depletion conditions. (b) Demographs displaying fluorescence intensity of iHT‐PBP2b localization upon MreC depletion (−Zn) or in the presence of MreC (+Zn) for the number of cells (n) aligned and displayed in each demograph. Microscopy and demographs are representative of three independent biological replicates. (c) Bar graph displaying localization patterns of bPBP2b, RodA, RodZ, aPBP1a, and bPBP2x after MreC depletion (−Zn). For each sample and condition, 100 cells were manually examined and scored according to the key. Data are averaged (± SEM) from two independent experiments. Strains used: IU16281 (iht‐pbp2b), IU16283 (iht‐rodA), IU14598 (rodZ‐FLAG), IU15901 (pbp1a‐FLAG), and IU16326 (iht‐pbp2x) in the ΔmreC//PZn‐mreC + background (see Table S1). Representative micrographs of proteins other than bPBP2b are in Figures S21, S25, and S26.
