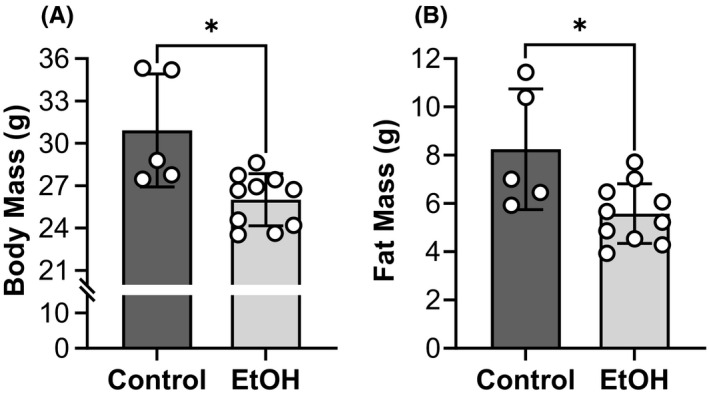
FIGURE 4.

Body mass and fat mass were lower in the EtOH group. Body mass (A) was obtained used an electric balance while fat mass (B) was assessed using nuclear magnetic resonance (NMR). Lean mass is presented in Figure 5A. All mice were female and the EtOH group consumed 20% EtOH in drinking water for approximately 40 weeks. *Significantly different than the control group (p < 0.05). Bars are mean ± SD. N = 10 for EtOH and 5 for control. EtOH, Ethanol.
