Figure 5.

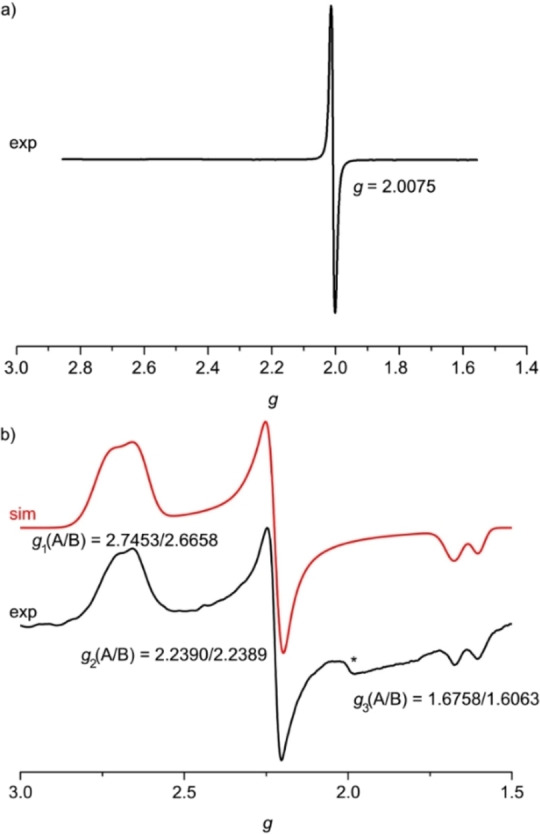
X‐band EPR spectra at 77 K of a) 1⋅+ in acetonitrile and b) 13+ in butyronitrile. Simulation of the spectrum with the parameters indicated shown in red. The asterisk denotes a baseline artifact.

X‐band EPR spectra at 77 K of a) 1⋅+ in acetonitrile and b) 13+ in butyronitrile. Simulation of the spectrum with the parameters indicated shown in red. The asterisk denotes a baseline artifact.