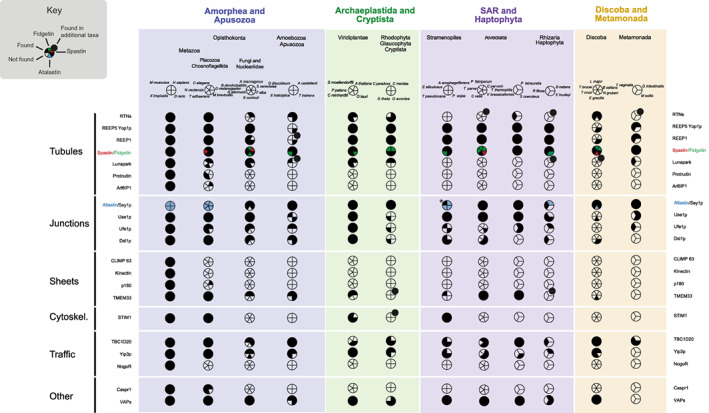
FIGURE 2.

Distribution of ER morphology proteins across eukaryotic lineages. Data are based on BLAST and HMMer results together with alignments and phylogenetic reconstruction. Filled sectors indicate the presence of the protein and empty sectors indicate that the relevant gene was not found. Large taxon groupings are colour coded, and the proteins are grouped based on their function in shaping the morphology of the ER, as in Table 1. Accession numbers are given in Table S3, and complete species names in Table S5. For spastin/fidgetin, the black colour indicates presence of both, pink indicates presence of spastin only, and green indicates presence of fidgetin only (Figure S3). *For Atlastin/Sey1p, blue colour indicates presence of Atlastin, black indicates presence of Sey1p, Ectocarpus siliculosus has both (Figure S4). For lineages checked with wider species sampling on the EukProt server (Table S6) a tangential bullet indicates that positive hits were found in other species of that lineage.
