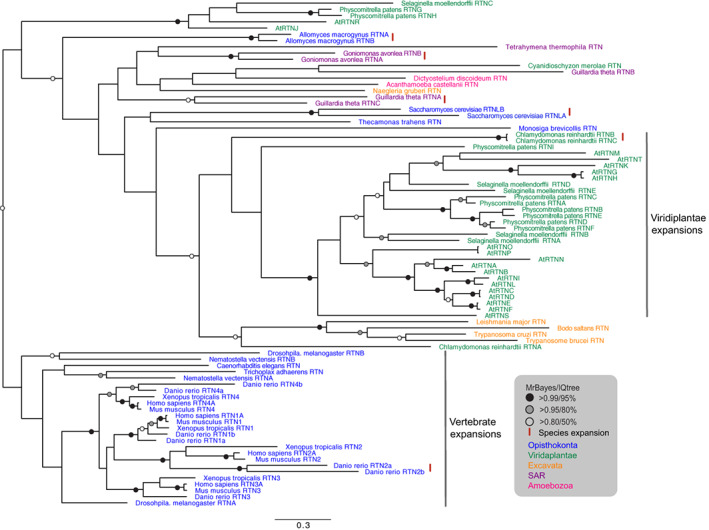
FIGURE 4.

Phylogenetic reconstruction of the reticulons. The tree shown is based on MrBayes. Well‐supported nodes in both the MrBayes and Maximum Likelihood (IQ) analyses are highlighted. The two major expansions in vertebrates and plants are also highlighted. The red lines ‘|’ indicate species‐specific duplications. Species names are coloured as in Figure 3. At, Arabidopsis thaliana.
