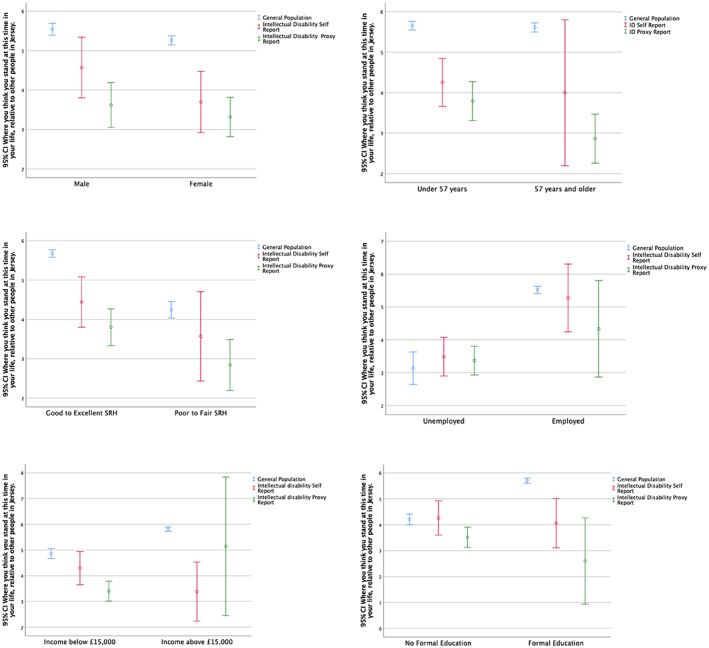
FIGURE 2.

Stratified error line graph [95% confidence interval (CI)] representing the mean SSS ladder score by gender, age, self‐rated health, employment, income and education. Note: Error line graph is used to visualise the concentratedness of the SSS scores. People with an intellectual disability who self‐reported had higher mean SSS ladder scores for unemployment and no formal education than the general population. People with an intellectual disability who responded through proxy reporting had higher mean scores on the SSS ladder for unemployment and income below £15,000 than the general population.
