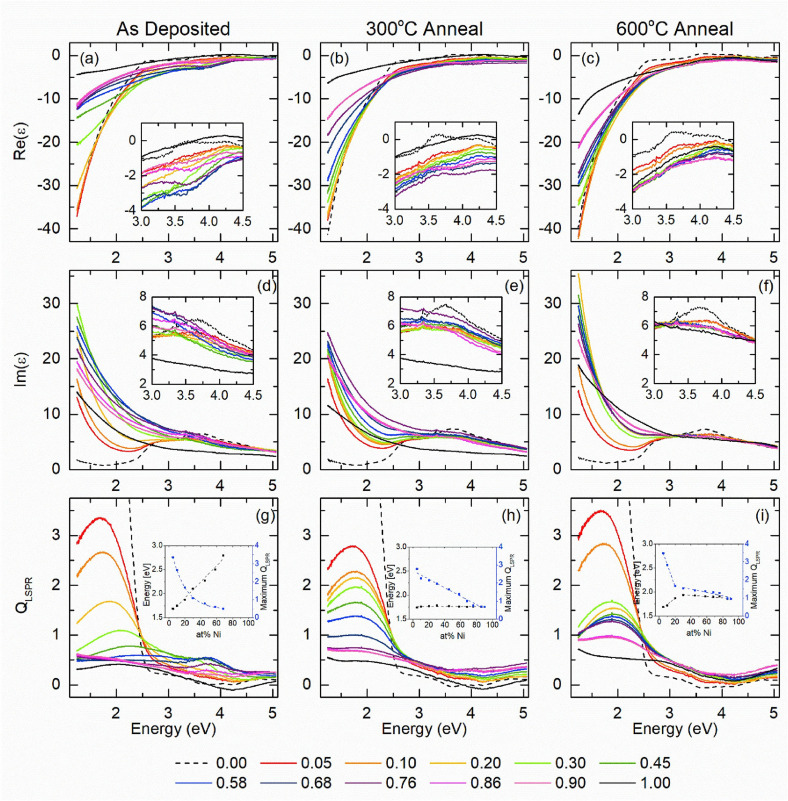
Figure 13.
The real and imaginary parts of dielectric constant and plasmonic quality factor in Au−Ni thin films with different compositions (indicated in the legend) as deposited (left panels) and after annealing at 300 and 600 °C (middle and right panels). Insets in OCs components show the magnification for specific energy intervals. Insets in the quality factor show the dependence of quality factor maximum value and energy location versus Ni content. Reprinted from Ref. [153], Copyright (2019), with permission from Elsevier.

