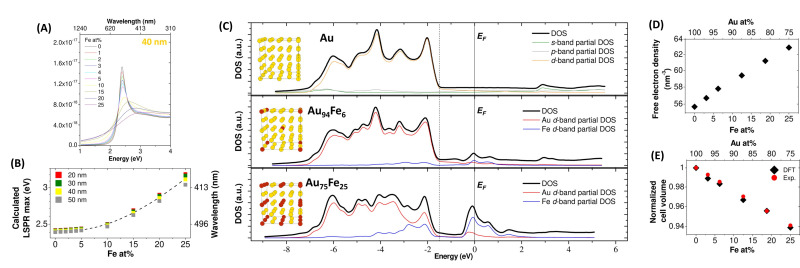
Figure 14.
(A) Simulated EELS spectra of a 40 nm Au−Fe alloy NP with various compositions. The quenching of the LSP is clearly appreciable while increasing Fe content. (B) The plot of calculated LSP resonance (LSPR) maximum versus composition for the same alloy and different sizes and compositions, showing the blue‐shift. (C) DOS calculated with DFT for pure Au, Au94Fe6 and Au75Fe25 showing the appearance of VBS close to Fermi energy (EF) in the alloys. (D) Calculated free electron density versus alloys composition. (E) Calculated and experimental cell volume versus alloy composition. Reprinted with permission from Ref. [40]. Copyright (2019) American Chemical Society.

