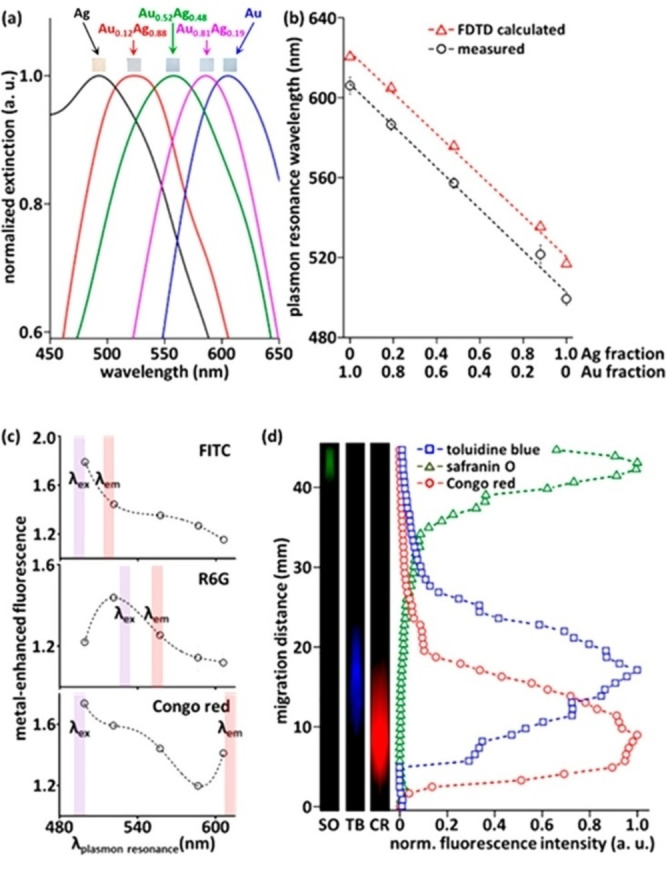
Figure 23.

MEF with Au−Ag nanoalloys in the paper substrate. (A) Optical extinction spectra showing a magnification of the LSP range for five Au−Ag NPs on cellulose substrates. (B) LSP wavelength calculated with FDTD simulations for the Au−Ag alloy NPs. (C) Fluorescence signal enhancement from three dyes (FITC, R6G and CR) showed twofold MEF from the substrates compared to the Whatman chromatography paper. The enhancement occurs when the LSP of Au−Ag alloy NPs matches the emission band of each specific dye. (D) Chromatographic MEF analysis. A three‐dye mixture was separated using paper chromatography, and then each component was selectively detected. Reprinted with permission from Ref. [225]. Copyright (2017), American Chemical Society.
