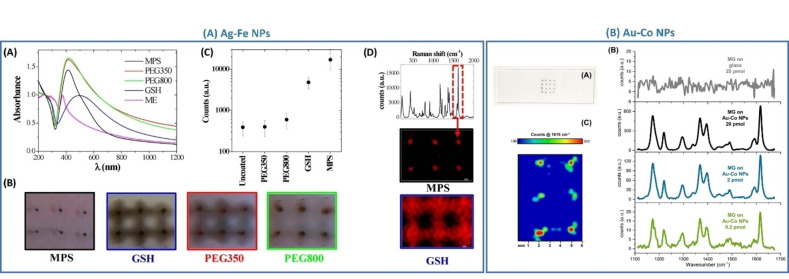
Figure 24.
Application of magnetic‐plasmonic nanoalloys as SERS substrates. (A) Ag−Fe NPs: (A) UV‐Vis spectra of the NPs coated with various ligands. (B) Photo of the magnetically assembled NPs on a glass substrate (distance between spots is 4 mm). (C) The intensity of the Raman band of malachite green (MG) at 1617 cm−1 measured on Ag−Fe NPs with different surface coatings. (D) 2D Raman map of the major band of MG collected on NPs coated with MPS and GSH. Reprinted with permission from Ref. [160]. Copyright (2017) Wiley‐VCH Verlag GmbH & Co. KGaA, Weinheim. (B) Au−Co NPs: (A) A 4×4 Array of magnetic‐plasmonic dots obtained on glass by drop‐casting and evaporation at room temperature of an Au−Co NPs solution. During the evaporation of the solution, a squared array of 16 permanent cylindrical magnets (2 mm in diameter ×8 mm length) was placed below the glass slide. (B) Raman spectra were collected with 647 nm excitation by deposing 20, 2 or 0.2 pmol of MG on the magnetic‐plasmonic dots (and reference with 20 pmol MG on the bare glass). (C) 2‐D map of the Raman intensity at 1615 cm−1 collected on 6 dots after deposition of 20 pmol of MG. Laser excitation at 532 nm. Reprinted with permission from Ref. [31]. Copyright 2021 Wiley‐VCH GmbH.

