
FIGURE 1.
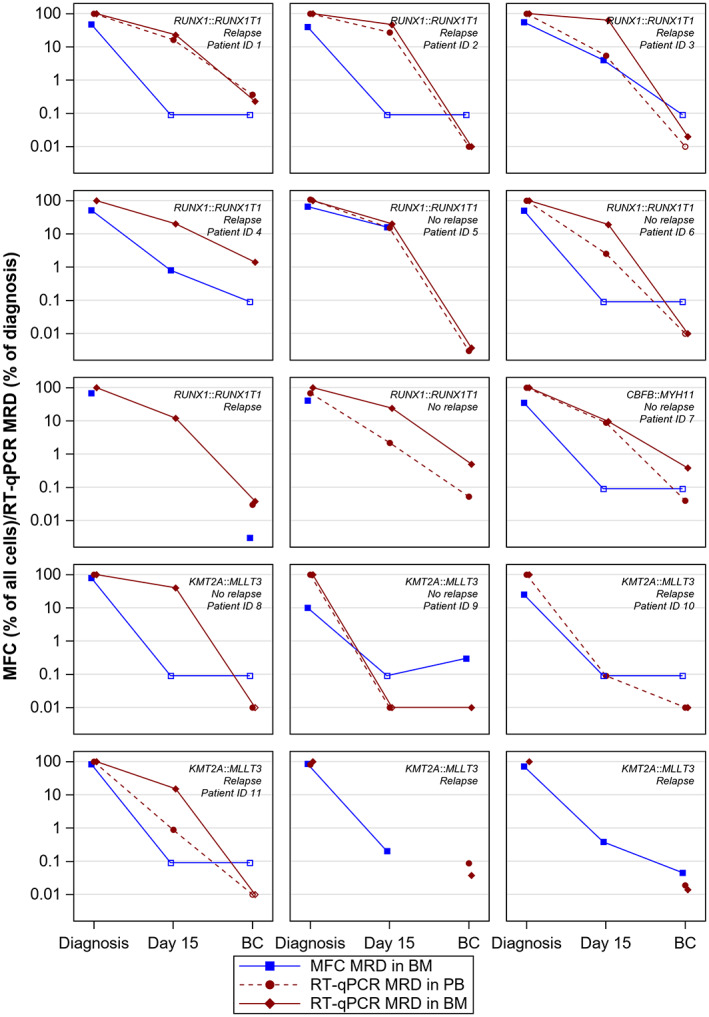
The kinetics of MRD during treatment in 15 children with AML. Fusion transcripts were assessed with RT‐qPCR in bone marrow and peripheral blood and MRD analysis with MFC was performed in bone marrow. Measurements were performed at diagnosis, day 15 in treatment and before start of consolidation (BC). Genetic aberration (RUNX1::RUNX1T1/CBFB::MYH11/KMT2A::MLLT3), relapse status, and ID (only applicable to patients depicted in Figure 2B) are stated. Filled symbols represent detectable levels of MRD and unfilled undetectable levels (depicted at level of detection for MFC and level of quantification for RT‐qPCR).