FIGURE 1.

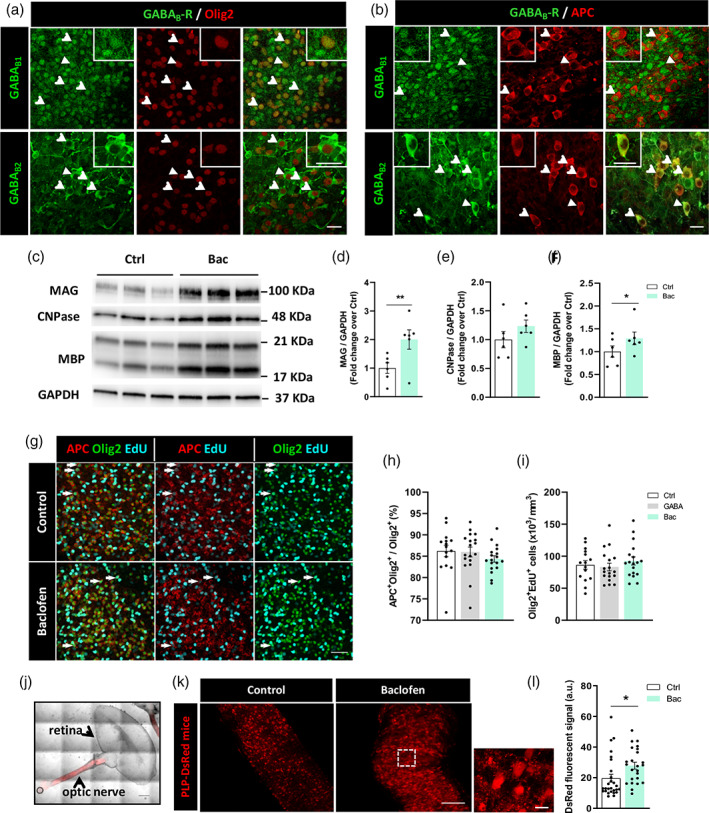
Baclofen increases myelin‐related protein synthesis in organotypic cultures without altering the proliferation ratio of oligodendroglial lineage. (a) Oligodendroglial cells, distinguished as Olig2+ cells (red), are positive for GABAB1 and GABAB2 subunits (green) of GABABRs in cerebellar slices of P5‐P7 rats. (b) Mature oligodendrocytes (OLs), identified as APC+ cells (red), express GABAB1, and GABAB2 subunits (green) of GABABRs in the same preparations. Arrows indicate double‐stained cells and arrowheads show the cell magnified in the corresponding inset. Scale bars = 20 μm. (c) Representative western blot image‐showing expression of myelin‐associated glycoprotein (MAG), CNPase, and MBP proteins in control and baclofen‐treated cerebellar slices. Quantification of MAG (d), CNPase (e), and myelin basic protein (MBP) (f) expression normalized to GAPDH values. *p < .05 and ** p < .01 versus control; paired Student's t‐test. (g) Representative images showing immunofluorescence of mature OLs (APC+, red) and total oligodendroglial cells (Olig2+, green) co‐labeled with EdU (cyan) to identify mature OLs (APC+) and Olig2+ cells in cerebellar slices in the indicated condition. Arrows indicate mature OLs (APC+Olig2+) or newly generated oligodendroglial cells (Olig2+EdU+). Scale bar = 50 μm. Quantification of (h) percentage of mature OL from total oligodendroglial cell pool (APC+Olig2+/Olig2+) and (i) density of newly formed oligodendroglial cells (Olig2+EdU+), in the indicated conditions. One‐way ANOVA followed by Tukey's post‐test. (j) Optic nerve‐retina unit from P11 PLP‐DsRed transgenic mice. Scale bar = 500 μm. (k) Optic nerves explants cultured in control conditions (left) or in presence of baclofen (right) showing DsRed fluorescent signal. Scale bars = 100 μm; higher magnification scale bar = 315 μm. (l) Quantification of DsRed fluorescent signal in control and treated optic nerve explants. *p < .05 versus control; unpaired Student's t‐test. (a–f): Control and bac 6 slices from different animals. (g–i): Control 15, GABA 18, and bac 18 images from cerebellar slices. (j–l): Control 27, bac 24 images from optic nerve explants
