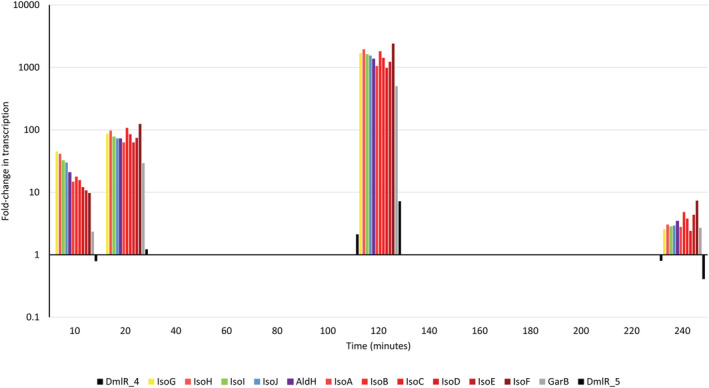
FIGURE 2.

Transcription of the iso gene cluster during induction by epoxyisoprene (bars = fold‐change in transcription), relative to Timepoint 0. Each colour corresponds to a specific iso metabolic gene (see Figure S2A), with data presented in the relevant 5′–3′ gene order. Y axes are presented on a Log(10) scale.
