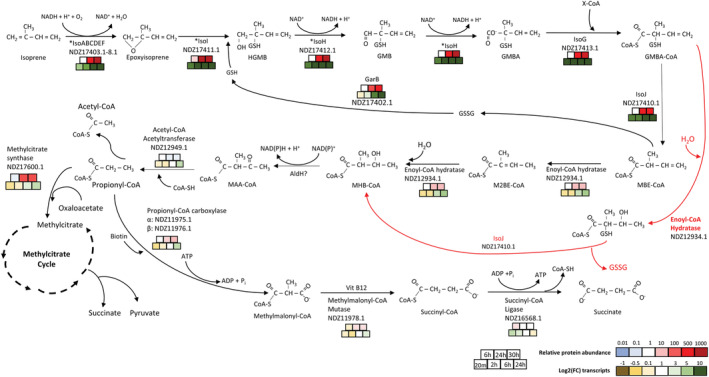
FIGURE 4.

Predicted metabolic pathway to incorporate isoprene into central metabolism, as determined by transcriptomic and proteomic approaches. Confirmed enzymatic steps are denoted by an asterisk (*). Viable alternative metabolic reactions are denoted by red arrows. Relative peptide abundance was calculated (from left to right) after 6, 24, and 30 h of growth on isoprene, with downregulation (blue) or upregulation (red) denoted according to colour. Fold‐change (FC) in gene expression was recorded after 20 min, 2, 6, and 24 h of growth on isoprene (left to right), with downregulation (yellow) or upregulation (green) denoted by colour. CoA‐SH, free CoA; TCA, tricarboxylic acid; Vit B12, vitamin B12; X‐CoA: unidentified CoA‐thioester
