
FIGURE 2.
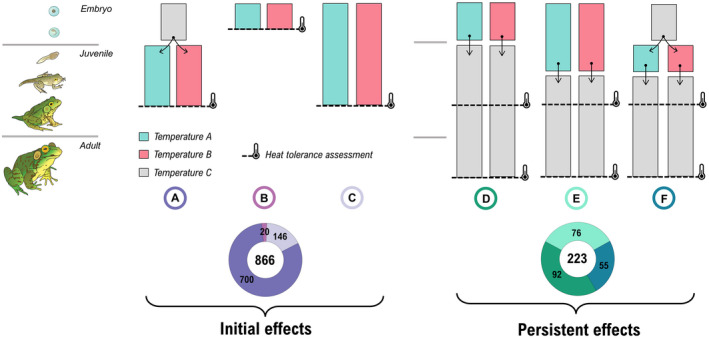
Experimental designs used to assess the developmental plasticity in heat tolerance in ectotherms. Experimental designs are grouped based on whether they assess the initial (a–c; without re‐acclimation to a common garden condition) or persistent (d–f; with re‐acclimation to a common garden condition after the initial acclimation) responses to developmental temperatures. Horizontal dashed lines represent when the heat tolerance was tested. The timing of heat tolerance measurement was positioned arbitrarily within a life history stage. In designs d, e and f, heat tolerance is assessed at either the juvenile or the adult stage following re‐acclimation, as denoted by the two heat tolerance symbols for each experimental design. Three temperatures (pink, green, grey) are presented here, but note that more temperatures can be used, and that the common temperature C can sometimes be identical to temperature a or b. Pie charts denote the number of effect sizes extracted for each type of experimental design.