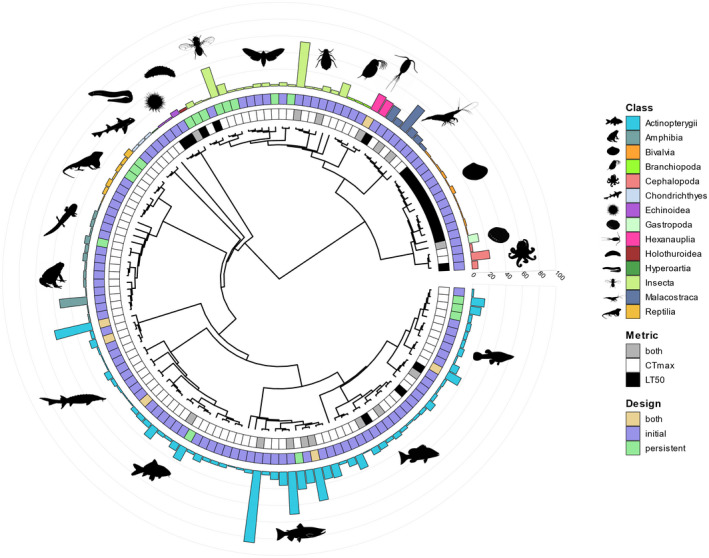
FIGURE 3.

Distribution and characterization of the effect sizes across the phylogeny. The histograms represent the number of effect sizes extracted for each species. The outermost heatmap represent whether the initial or persistent effects of developmental temperatures (or both, cf. Figure 2) were assessed for this species. The innermost heatmap depicts whether the critical thermal maximum (i.e., CTmax), the median lethal temperature (i.e., LT50), or both metrics were assessed for this species. Phylogeny was constructed from the Open Tree of Life (Michonneau et al., 2016), and branch lengths were computed using Grafen's method. Silhouettes were taken from PhyloPic (www.phylopic.org).
