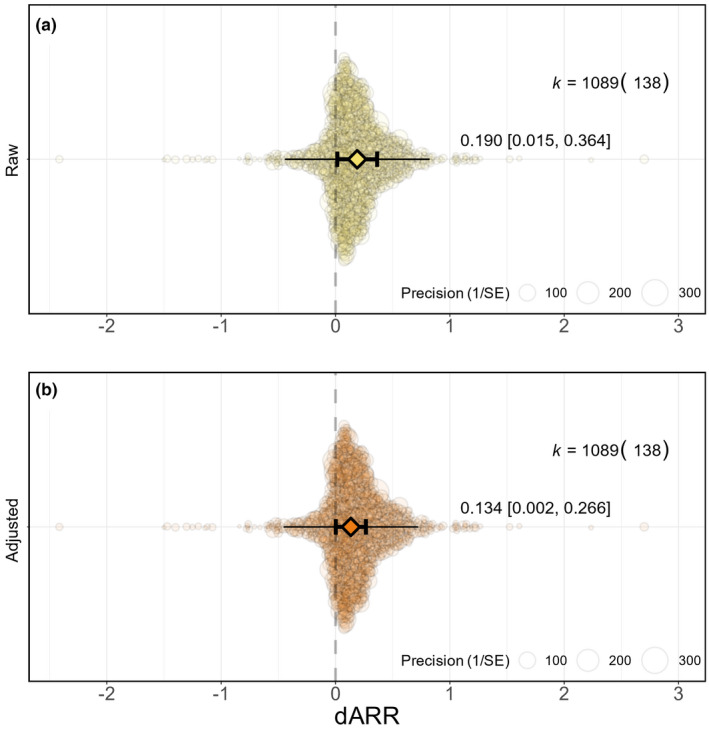
FIGURE 4.

Overall level of developmental plasticity in heat tolerance. Mean meta‐analytic estimates (triangles) with their 95% confidence intervals (thicker bars with whiskers) and prediction intervals (thinner bars without whiskers) are depicted along with individual data points (coloured circles) scaled by precision (inverse of standard error). Results are presented before (a) and after (b) controlling for the over‐representation of data from aquatic vs. terrestrial animals. The graphs were constructed using the orchaRd package (Nakagawa et al., 2021; version 2.0). k: number of effect sizes (number of species). dARR: developmental acclimation response ratio.
