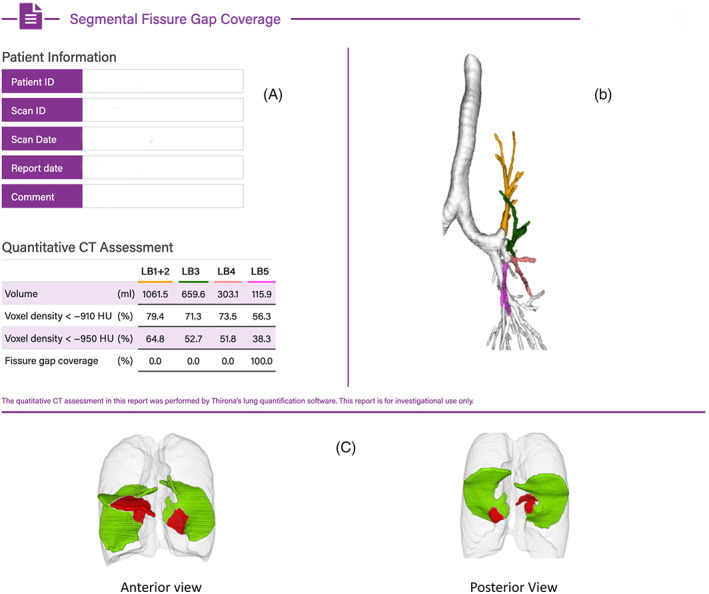
FIGURE 1.

Example of segmental mapping of lingula fissure defect (LB4 and LB5). Single left oblique fissure defect seen, subtended by LB5. (A) LUL segments by volume, voxel density and subtending fissure defects (single defect in LB5 segment). (B) Colour coded graphical representation of mapped segments. (C) Fissure mapping with red representing areas of fissure deficiency and green representing areas where fissures are intact
