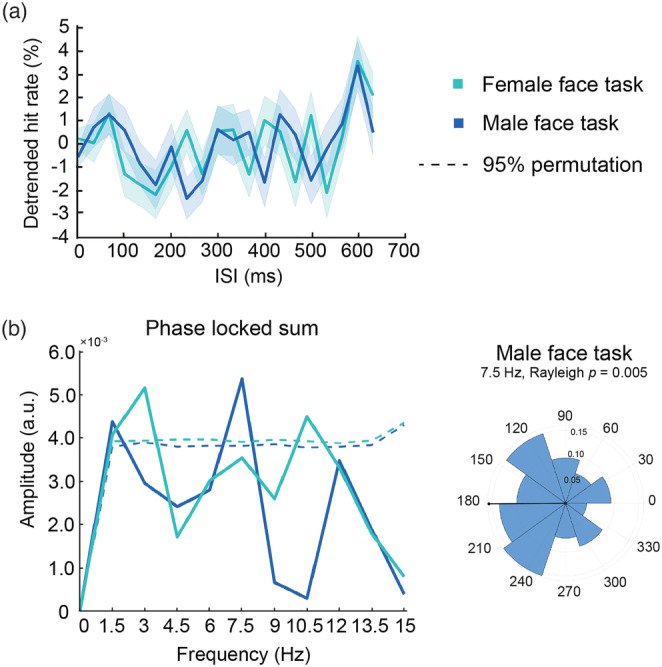
FIGURE 5.

(a) Detrended HR as a function of ISI in female face detection task (light blue) and male face detection task (dark blue). Solid lines represent detrended HR. shaded areas represent SEM. (b) Left: Phaselocked amplitude of group spectra. The dashed lines represent 95% percentile of permutations used to define significance of the peaks before multiple correction. Right: Polar histogram of the phase angle distribution for the highest peaks.
