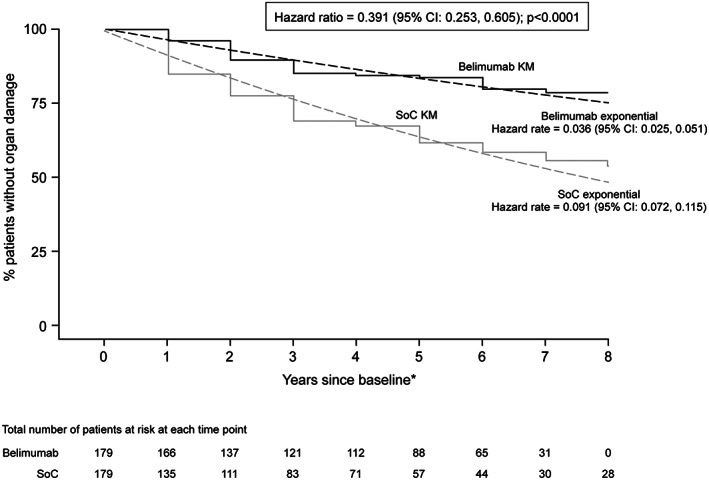
Figure 3.

Post hoc longitudinal propensity score matching comparative analysis of time to organ damage progression. Years are 48 weeks in length (asterisk). 95% CI = 95% confidence interval; KM = Kaplan‐Meier curve; SoC = standard of care. Reproduced, with permission, from ref. 38.
