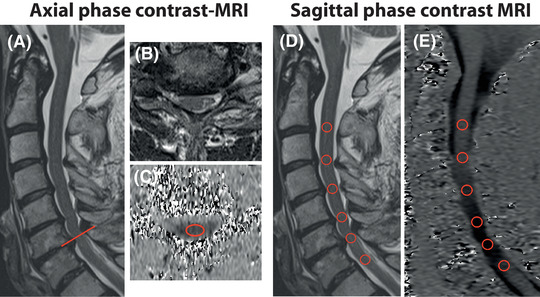
FIGURE 1.

Illustrative example of axial and sagittal phase contrast measurements. In a patient with a multisegmental cervical stenosis, maximum stenosis was observed at segment C6 (A; midsagittal T2 weighted [w]; B; axial T2w). Spinal cord motion was assessed with an axial phase contrast‐MRI (PC‐MRI) slice (C), orientated perpendicular to the spinal cord (A; red line showing slice orientation) with a predefined region of interest (ROI) (C; axial PC‐MRI; segment C6; ROI = red ellipse). In sagittal phase contrast imaging, all cervical segments were obtained with a predefined ROI (D; midsagittal T2w; E; midsagittal PC‐MRI; ROIs = red circles). Velocity in PC‐MRI (C, axial PC‐MRI; E, sagittal PC‐MRI) was encoded in gray values, while darker colors represent higher caudal motion.
