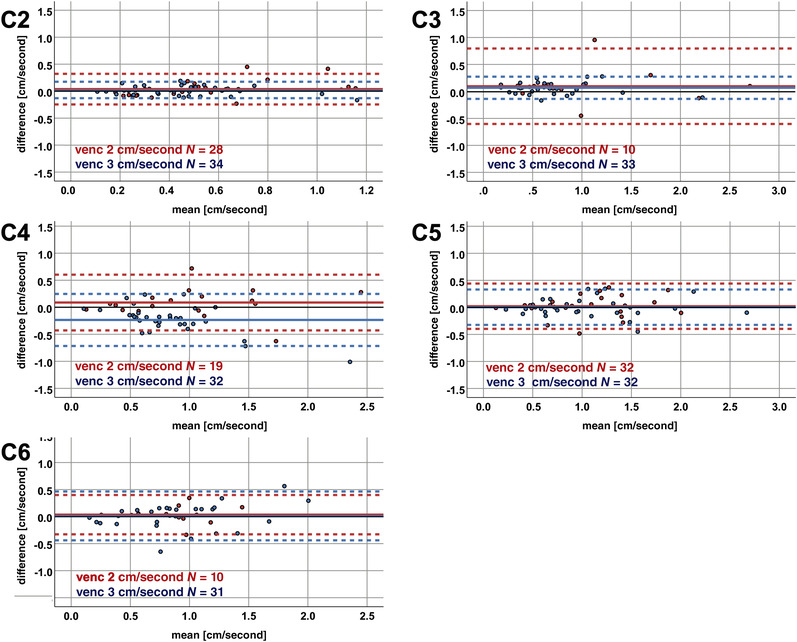
FIGURE 5.

Bland‐Altman plots for subgroups with velocity encoding of 2 versus 3 cm/second measurements. The mean of the amplitudes (x‐axis) and the differences of the axial minus sagittal amplitude values (y‐axis) are plotted in each cervical segment for measurements with velocity encoding (venc) of 2 cm/second (red color) versus venc 3 cm/second (blue color). The solid horizontal line represents the mean of all measurement values, while the pointed lines represent the limits of agreement (1.96 × standard deviation). The black solid horizontal line illustrates the 0 value reference for amplitude differences. N, number of measurements.
