

Abstract
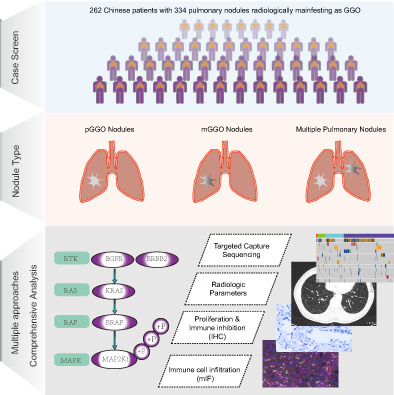
Ground‐glass opacity (GGO)‐associated pulmonary nodules have been known as a radiologic feature of early‐stage lung cancers and exhibit an indolent biological behavior. However, the correlation between driver genes and radiologic features as well as the immune microenvironment remains poorly understood. We performed a custom 1021‐gene panel sequencing of 334 resected pulmonary nodules presenting as GGO from 262 Chinese patients. A total of 130 multiple pulmonary nodules were sampled from 58 patients. Clinical‐pathologic and radiologic parameters of these pulmonary nodules were collected. Immunohistochemistry (IHC) and multiplex immunofluorescent staining (mIF) were applied to analyze proliferation and immune cell markers of GGO‐associated pulmonary nodules. Compared with pure GGO nodules, mixed GGO nodules were enriched for invasive adenocarcinoma (IAC) (182/216 vs 73/118, P < .001). Eighty‐eight percent (294/334) of GGO‐associated nodules carried at least one mutation in EGFR/ERBB2/BRAF/KRAS/MAP2K1 of the RTK/RAS signaling pathway, and the alterations in these driver genes were mutually exclusive. The analysis of multifocal pulmonary nodules from the same patient revealed evidence of functional convergence on RTK/RAS pathways. Nodules with ERBB2/BRAF/MAP2K1 mutations tended to be more indolent than those with EGFR and KRAS mutations. IHC and mIF staining showed that KRAS‐mutant GGO nodules displayed higher infiltration of CD4+ T cell and CD8+ T cell as well as stronger proliferation and immune inhibitory signals. Our study demonstrates a driver landscape of radiologically detectable GGO‐associated pulmonary nodules in Chinese patients and supports that different driver patterns in RTK/RAS pathway are corresponding to different radiologic features.
Keywords: ground‐glass opacity, immune microenvironment, pulmonary nodules, radiologic features, RTK/RAS pathway
What's new?
Pulmonary lesions with ground‐glass opacity (GGO) detected on computed tomography (CT) are commonly observed in lung adenocarcinoma and its precursors. GGO are pathologically and molecularly diverse, though associations between their genetic and radiologic features remain poorly defined. Here, using a custom gene panel, the authors applied high‐depth sequencing to GGO‐associated pulmonary nodules revealed by CT in Chinese patients. Mutations in the RTK/RAS signaling pathway were present in 88% of GGO‐associated nodules. Distinct pathological, radiological and immune features of GGO‐associated nodules were defined by alterations in common driver genes in the pathway, namely EGFR, KRAS, BRAF, ERBB2 and MAP2K1.
Abbreviations
- AAH
atypical adenomatous hyperplasia
- AIS
adenocarcinoma in situ
- CT
computed tomography
- CTR
consolidation‐to‐tumor ratio
- FDR
false discovery rate
- GGO
ground‐glass opacity
- IAC
invasive adenocarcinoma
- IHC
immunohistochemistry
- LUAD
lung adenocarcinoma
- mGGO
mixed GGO
- MIA
minimally invasive adenocarcinoma
- mIF
multiplex immunofluorescent staining
- pGGO
pure GGO
- SNVs
single‐nucleotide variants
- TKIs
tyrosine kinase inhibitors
- TMB
tumor mutation burden
- TPS
tumor proportion score
- VAF
variant allele frequency
1. INTRODUCTION
Lung cancer remains the leading cause of cancer incidence and mortality worldwide, with adenocarcinoma being the most common histologic subtype. 1 , 2 During the past decade, the rapid development of high‐resolution computed tomography (CT) and low‐dose CT screening has dramatically increased the detection of early lung adenocarcinoma (LUAD). 3 , 4 Clinically, a considerable number of pulmonary nodules are characterized as lesions with ground‐glass opacity (GGO) by CT scans. GGO is divided into pure GGO (pGGO) and mixed GGO (mGGO) according to the radiologic texture of pulmonary nodules. Emerging evidence demonstrated that some pGGO nodules can develop into mGGO nodules. 5 GGO nodules could be seen in LUAD and its precursors, which encompass atypical adenomatous hyperplasia (AAH), adenocarcinoma in situ (AIS), minimally invasive adenocarcinoma (MIA) and invasive adenocarcinoma (IAC). 6 , 7 Previous studies have shown that the natural course of GGO‐associated LUAD patients have a 5‐year survival rate of almost 100% after surgical resection. 8 Thus, pulmonary nodules presenting with pathologically different GGO may have distinct molecular profiles.
More than 70% of AIS, MIA or IAC patients carry at least one cancer‐related gene mutation in the RTK/RAS pathway, especially in East Asian lung cancer patients. 9 , 10 , 11 Increasing evidence supports that the activation of RTK/RAS pathway could be an early event in LUAD tumorigenesis. 12 , 13 However, the associations between the common driver genes in RTK/RAS pathway and radiologic features in GGO‐associated LUAD remain poorly defined.
Herein, we performed high‐depth sequencing of 334 radiologically detected GGO‐associated pulmonary nodules (diameter ≤ 30 mm) from 262 patients with a custom 1021‐gene panel. The RTK/RAS pathway alterations, including variations in EGFR, KRAS, ERBB2, BRAF and MAP2K1 were identified as the predominant driver events and were mutually exclusive to each other in GGO nodules. Multiple nodules from the same patient showed distinct oncogenic alterations, but most patients had at least one nodule showing alterations in the RTK/RAS pathway. The nodules carrying ERBB2/BRAF/MAP2K1 mutations were more indolent than those with EGFR/KRAS mutations based on radiologic, pathologic and immunostaining analysis. For the EGFR‐mutant nodules, the co‐occurrence of TP53 mutations was associated with a more aggressive behavior. EGFR‐mutant GGO nodules showed the highest proliferation ability which may relate to the early relapse of GGO‐associated pulmonary nodules. KRAS‐mutant GGO nodules were enriched for PD‐L1 expression and the infiltration of CD4+ and CD8+ T cells, while BRAF‐, ERBB2‐ and MAP2K1‐mutant GGO nodules showed a “cold” immune signature. In conclusion, our findings profiled the driver events of RTK/RAS pathway in LUAD with GGO and provided an insight for the detection and clinical treatment of GGO‐associated pulmonary nodules.
2. MATERIALS AND METHODS
2.1. Patients and samples
We retrospectively analyzed 262 Chinese patients with pulmonary nodules radiologically manifesting as GGO, who underwent surgery of R0 resection at the Department of Thoracic Surgery, The Second Xiangya Hospital of Central South University from January 2018 to September 2019. None of the 262 patients received neoadjuvant chemotherapy or radiotherapy before surgery. Nodules larger than 30 mm in size are considered as masses and were excluded. After preoperative radiologic and pathological assessment (by two independent pathologists), a total of 334 nodules were confirmed as malignant tumors or precursor glandular lesions (including AAH and AIS) and were included in this study. The detailed clinical characteristics of the patients (nodules) are listed in Table S1.
2.2. Comprehensive genomic profiling
Comprehensive genomic profiling was carried out on these samples using a custom panel of 1021 cancer‐related genes (Table S2). The detailed descriptions of DNA extraction, library construction, next‐generation sequencing and the data processing were reported previously. 14 , 15 Tumor mutation burden (TMB) was calculated as the number of all the nonsynonymous mutations per mega base of coding regions of genome sequenced. The sequencing coverage and quality statistics for each sample are summarized in Table S3.
2.3. Radiologic parameters
Preoperative nonenhanced CT imaging of the chest from all 262 patients was performed at the Second Xiangya Hospital of Central South University. CT images were obtained with the CT scanner SOMATOM Force (Siemens) with parameters: 120 kVp and 100 to 200 mAs; reconstruction with a thickness of 1 mm. CT images were acquired in the supine position at full inspiration. Then, CT images were transferred to FACT Medical Imaging System (Version: FACT‐Lung 1.7.3.3) in the DICOM format. According to the algorithm of the FACT system, the segmentation and measurements were finished automatically, and the volume and mean CT value of the nodules were obtained. A single thoracic radiologist supervised the entire process and evaluated the analysis results. If the delineation were unsatisfactory, the radiologist would remark the target region and delineated the margin manually before automatic measurements. The consolidation‐to‐tumor ratio (CTR) was calculated from the ratio of the maximum diameter of the solid component to the maximum diameter of the largest cross‐sectional area of the lesions, which were measured manually. The nodule mass was calculated according to the equation: Mass = Volume × [(mean CT attenuation + 1000) × 0.01].
2.4. Immunohistochemistry staining of Ki‐67 and PD‐L1
Tissues were processed to make formalin‐fixed paraffin‐embedded blocks following standard clinical procedures. Three micrometer serial sections were cut for IHC staining of Ki‐67 and PD‐L1. Expression of Ki‐67 and PD‐L1 were independently scored by two lung cancer pathologists. The PD‐L1 expression in tumor regions was quantified and positive expression in at least 1% of tumor cells was defined as positive expression for the specimen.
2.5. mIF and Image analysis
Tissue mIF was conducted by Opal Polaris 5color IHC staining kit including PD‐L1, CD4+ T cells, CD8+ T cells, FoxP3+ regulatory T cells and Granzyme B (Akoya Biosciences) according to the manufacturer's protocol. The whole slide image was scanned and representative 5 to 7 regions of interest were chosen by the pathologist at ×200 resolution as multispectral images. Image analysis was performed using the InForm 2.4.8 Image Analysis Software.
2.6. Statistical analyses
All statistical analyses were performed by using R statistical environment version 3.3.4 or GraphPad Prism 8.0. Unless specified otherwise, a two‐sided Wilcoxon rank sum test was used to compare the differences between two groups of continuous variables. Kruskal‐Wallis test was used to compare the differences among more than two groups of continuous variables. A two‐tailed Fisher's exact test was used to compare categorical variables across groups. For multiple testing corrections, FDR corrections were performed. A P value <.05 or FDR q < 0.05 was considered as statistical significance.
3. RESULTS
3.1. Overview of clinical characteristics
From January 2018 to September 2019, 334 radiologically detected pulmonary nodules presenting as GGO (size, 3.4‐30 mm) were collected from 262 patients who underwent surgery of R0 resection. The clinicopathologic and radiologic characteristics are shown in Table S1. These nodules included 38 precursor glandular lesions (AAH, n = 5; AIS, n = 33) and 296 LUAD classified as stage IA1 (n = 168), stage IA2 (n = 77), stage IA3 (n = 11) and stage IB (n = 40) according to the eighth edition of the American Joint Committee on Cancer. 16 The LUAD could also be categorized into MIA (n = 80) and IAC (n = 216) histologically. Among the 334 GGO nodules, 79 (23.7%) were pGGO and 255 (76.3%) were mGGO. Specifically, mGGO nodules were enriched in IAC suggesting a more aggressive phenotype than pGGO (182/216 vs 73/118, P < .001; Figure 1A, left). Additionally, the invasive nodules were different from their preinvasive counterparts in terms of CTR, indicating the role of radiologic parameters in differentiating malignant components (Figure 1A, right).
FIGURE 1.
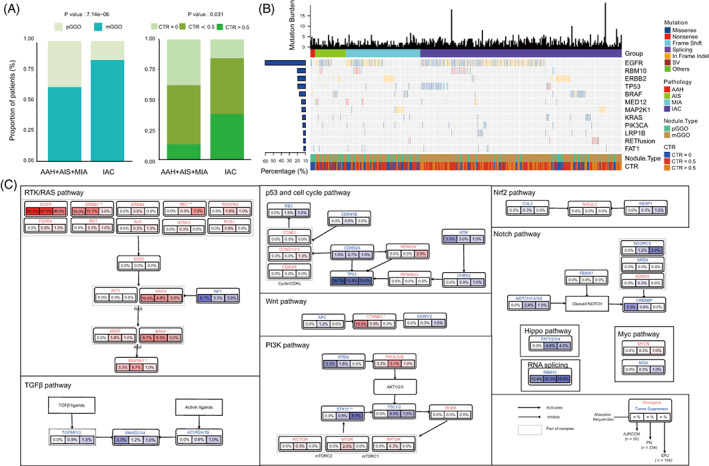
Driver genes for small pulmonary nodules in Chinese patients. (A) Stacked bar plots showing the association of histologic subtypes with the radiologic manifestation of GGO nodules. The differences were compared using Fisher's exact test. (B) Landscape of somatic alterations in GGO‐associated pulmonary nodules, including single‐nucleotide variants (SNVs), indels and gene rearrangements (fusion). Top, tumor mutation burden; left, alteration prevalence of each gene. (C) The comparison of frequently mutated genes in 10 cancer‐associated pathways among three different cohorts [Color figure can be viewed at wileyonlinelibrary.com]
3.2. Comparison of genomic landscape across cohorts
To understand the cancer‐associated genes in GGO nodules, a custom panel of 1021 genes was used for genomic analysis of all 334 nodules (Table S2). A total of 774 somatic single‐nucleotide variants (SNVs) and 259 indels were identified in all GGO nodules (Figure 1B). EGFR was the most commonly mutated genes (57.8%), followed by RBM10 (12.0%), ERBB2 (11.4%), TP53 (11.4%), BRAF (9.0%), MED12 (6.0%), MAP2K1 (5.7%) and KRAS (4.8%). Notably, 88.0% (294/334) of patients carried at least one mutation in EGFR/ERBB2/BRAF/KRAS/MAP2K1, five driver genes of RTK/RAS signaling pathway. To compare the genomic differences between our cohort and other GGO datasets, we analyzed the data from another two Chinese GGO‐associated cohorts (AJRCCM, n = 30; ERJ, n = 154). 5 , 17 Generally, the alteration frequencies of the members of the cancer‐associated pathways were similar among the three cohorts (Figure 1C). Given that the three cohorts had different distribution of clinical parameters such as stage and nodule texture, the differences between cohorts in several genes might be due to these factors. Consistent with the findings in our cohort, the alterations in EGFR/ERBB2/BRAF/KRAS/MAP2K1 were also markedly pervasive in the other two cohorts, therefore, we focused on RTK/RAS signaling pathway, especially these five driver genes in the following analyses.
3.3. Variations in RTK/RAS pathway in multiple pulmonary nodules
To further investigate whether internodal heterogeneity exists in GGO nodules, an undetermined radiologic feature of pulmonary nodules, we analyzed the cases with multiple nodules available. A total of 58 patients (130 nodules) were such cases with 45 patients having two, 12 patients having three and one patient having four nodules. Among them, 19 patients had shared mutations (ie, mutations appearing in multiple nodules of each patient), and EGFR p.L858 was the most common shared mutations (in 10/19 patients; Figures 2 and S1). Although most patients had only private mutations (ie, mutations specific to one nodule of each patient), 72.4% (42/58) patients carried at least one mutation affecting RTK/RAS pathway (Figures 2 and S1). Similar to the previous study, 18 we speculated that the evolution trajectories of GGO‐associated multiple primary pulmonary nodules of independent clonal origin might converge on RTK/RAS pathway due to constraint and functional selection.
FIGURE 2.
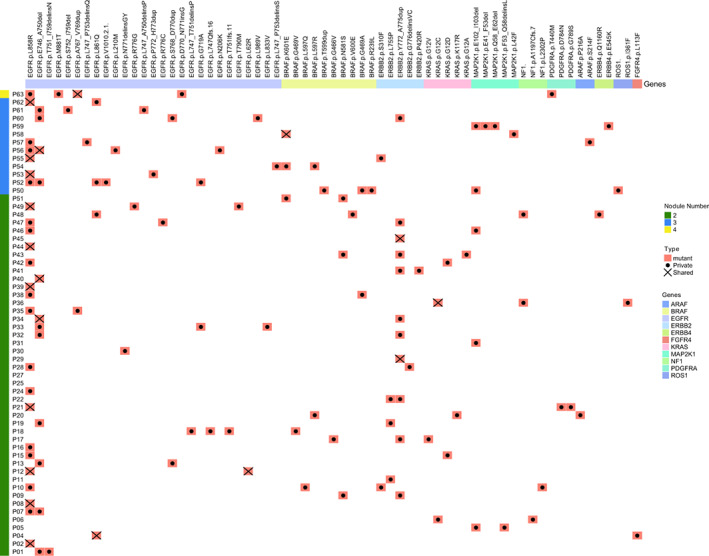
Driver mutations of RTK/RAS pathway in patients with multiple GGO nodules. Heatmap showing the presence of driver mutations of RTK/RAS signaling pathway in each patient with multiple GGO nodules. The number of nodules for each patient is annotated on the left. Mutations are grouped together according to the genes (top). For the mutations in each patient, those affecting more than one nodule are defined as “shared” and denoted with a cross, while those affecting only one nodule are defined as “private” and denoted with a dot [Color figure can be viewed at wileyonlinelibrary.com]
3.4. Mutual exclusivity of driver mutations in RTK/RAS pathway in GGO‐associated pulmonary nodules
In the previous analysis, we identified prevalent alterations in EGFR, ERBB2, BRAF, KRAS and MAP2K1, members of RTK/RAS pathway, in GGO‐associated pulmonary nodules (Figure 1B, C). To further illustrate the mutational pattern of the five genes, we depicted the driver mutations of them in our cohort and found that the alteration of them tended to be mutually exclusive to each other (Figure 3). Take EGFR for example, the mutually exclusive pattern was observed in KRAS (1/193 vs 15/141, P < .001), ERBB2 (3/193 vs 1/141, P < .001), BRAF (1/193 vs 29/141, P < .001) and MAP2K1 (1/193 vs 26/141, P < .001) when comparing the prevalence of mutations in the EGFR‐mutant vs EGFR‐wildtype cases. Namely, nodules with mutations affecting more than one of the five genes were very rare. A previous study has reported that mutually exclusive patterns act as an argument for redundancy in oncogenic pathway activation, 19 we thus speculated that one of the five mutated driver genes was sufficient to trigger the RTK/RAS pathway and the presence of another mutated gene within the same pathway would not improve the fitness. Taken together, our result demonstrated that these five genes could drive GGO‐associated pulmonary nodules independently and suggested an important role of RTK/RAS pathway alteration in the development of LUAD. Additionally, across all EGFR‐mutant nodules, 48.2% of EGFR mutation sites were L858R, 37.3% were exon 19 deletions and 9.8% were exon 20 insertions (Figure 3). Notably, EGFR T790M mutation was detected in C031 of P49 (Figure S1), which was a nodule with CTR > 0.5 and was pathologically defined as MIA. Although this was a rare case, it raised the possibility of primary EGFR resistance for GGO‐associated pulmonary nodules, given that EGFR T790M mutation in LUAD contributes to the resistance of EGFR inhibitors. 11 However, without similar findings in other large cohorts, we could not draw a solid conclusion.
FIGURE 3.
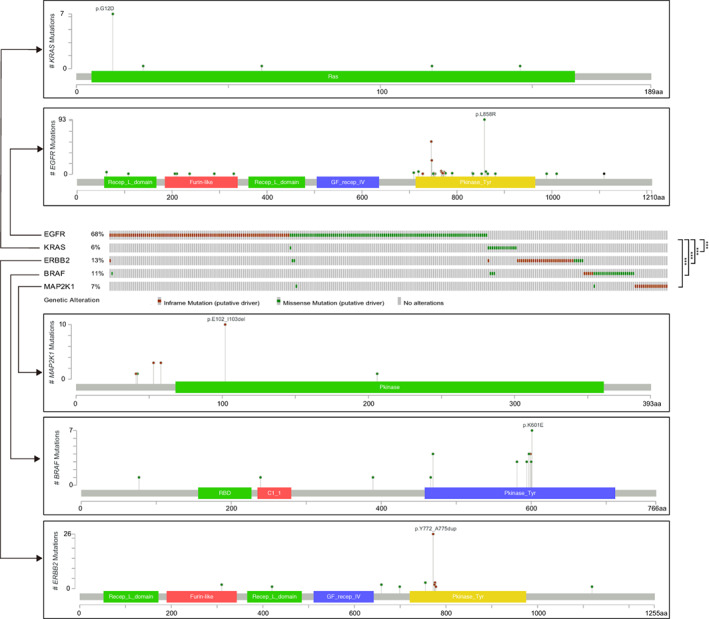
The variation patterns of five driver genes in RTK/RAS pathway in Chinese pulmonary nodules. Mutually exclusive analysis and lolliplots of amino acid alterations of EGFR, ERBB2, BRAF, KRAS and MAP2K1. Significance was calculated by two‐tailed Fisher's exact test (***P < .001) [Color figure can be viewed at wileyonlinelibrary.com]
3.5. Association between clinical features of GGO‐associated pulmonary nodules and driver gene alteration in RTK/RAS pathway
To investigate the associations of clinical features including smoking status, pathology and radiology with a single oncogenic driver of RTK/RAS pathway, we divided the GGO nodules into EGFR‐mutant (n = 187), KRAS‐mutant (n = 11), ERBB2‐mutant (n = 34), BRAF‐mutant (n = 25) and MAP2K1‐mutant (n = 17) groups after excluding samples with mutations affecting more than one of the five genes. Compared with the other groups, the KRAS‐mutant group displayed enrichment of smokers, invasive nodules and harbored a broad range of TMB (0‐18; Figure 4A‐C). Of note, the KRAS‐mutant group was enriched for IAC, suggesting the relevance of KRAS mutation with the aggressive behavior of GGO nodules (Figure 4B). Although most nodules were mGGO (Table S1), there was a bias of nodule type distribution among groups with different driver gene mutations (P = 2.78e‐03), and the EGFR‐mutant group seemed to harbor more mGGO nodules than the other groups (Figure 4D). Given that mGGO nodules tended to be more aggressive than pGGO (Figure 1A), this observation suggested the association of EGFR with the aggressive phenotype of mGGO nodules. Less nodules with CTR > 0.5 were observed in groups with mutations in ERBB2, BRAF and MAP2K1 (Figure 4E). Additionally, nodules with mutations in ERBB2, BRAF and MAP2K1 tended to have smaller CT size (Figure 4F). Furthermore, compared with EGFR‐/KRAS‐mutant groups, the radiologic features (including CT size, CT mass, CT volume and CT value) were lower in groups with ERBB2, BRAF and MAP2K1 mutations (Figures 4F‐I and S2). Therefore, we speculated that the alterations of ERBB2, BRAF and MAP2K1 might be associated with the indolent behavior of GGO nodules.
FIGURE 4.
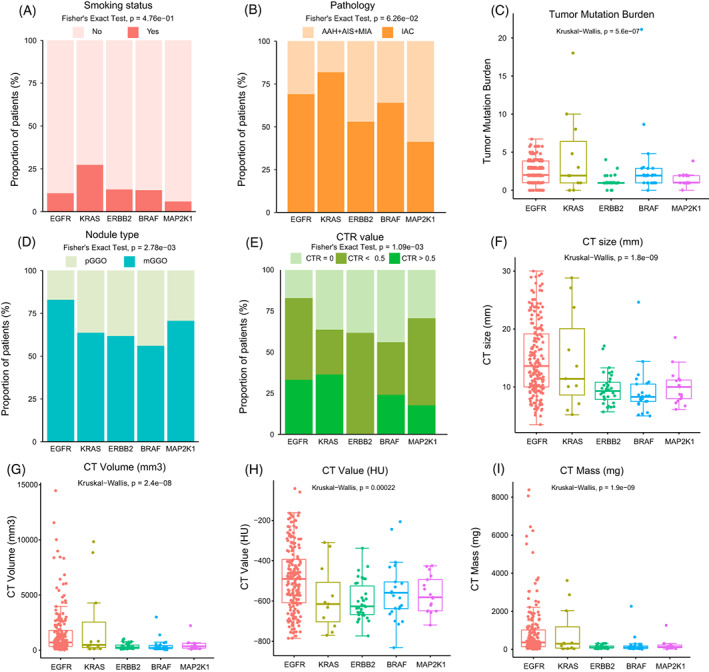
The association of driver genes in RTK/RAS pathway with clinicopathologic and radiologic features in GGO nodules. (A‐I) Comparisons of smoking status (A), pathology (B), TMB (C), nodule type (D), CTR value (E), CT size (F), CT volume (G), CT value (H) and CT Mass (I) among different groups of GGO nodules defined by driver genes in RTK/RAS pathway. The global differences among the five groups were assessed by Fisher's exact test or by Kruskal‐Wallis test as appropriate [Color figure can be viewed at wileyonlinelibrary.com]
Co‐occurrence of EGFR mutations with RBM10 or TP53 mutations existed in 17.9% and 16.9% of EGFR‐mutant nodules, respectively (Figure S3A). Compared with EGFR/RBM10‐mutant and EGFR/neither‐mutant subgroups, EGFR/TP53‐mutant subgroup was enriched for IAC, mGGO and nodules with CTR > 0.5 (Figure S3B‐D). Additionally, generally higher levels of radiologic features (Figure S3E‐H) as well as TMB (Figure S3I) were observed in the EGFR/TP53‐mutant than in the other subgroups. Taken together, co‐occurrence of EGFR and TP53 mutations might be associated with aggressive phenotypes of GGO nodules.
3.6. GGO‐associated pulmonary nodules with ERBB2 , BRAF or MAP2K1 alteration of RTK/RAS pathway showed an indolent feature
To investigate the association of RTK/RAS pathway with the vitality of GGO nodules, we evaluated the expression of Ki‐67, a well‐known cell proliferation marker by IHC staining. We found that KRAS‐ and the EGFR‐mutant groups displayed higher expression of Ki‐67 than the other groups (Figure 5A,C). Given that KRAS and EGFR mutations were enriched in the IAC (Figure 4B), we postulated that KRAS and EGFR mutations might promote both invasiveness and growth in LUAD.
FIGURE 5.
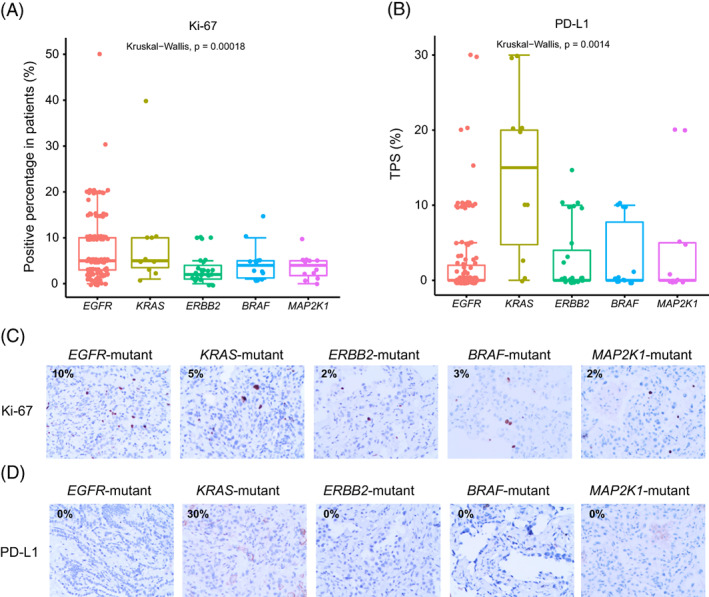
The expression of Ki‐67 and PD‐L1 in pulmonary nodules presenting as GGO. (A,B) Representative immunohistochemistry staining images of Ki‐67 (A) and PD‐L1 (B). (C,D) Comparison shows Ki‐67 (C) and PD‐L1 (D) expression in each patient across EGFR, KRAS, ERBB2, BRAF and MAP2K1‐mutant groups. Kruskal‐Wallis test was used to assess the differences among groups [Color figure can be viewed at wileyonlinelibrary.com]
Previous studies have shown correlations of driver genes such as EGFR and KRAS with immune infiltration in LUAD. 20 , 21 High levels of immune cell infiltration in KRAS‐mutant LUAD have been reported. 21 To explore the immune microenvironment of the GGO nodules related to RTK/RAS pathway, we first detected the expression level of PD‐L1 by IHC staining. Tumor proportion score (TPS) of PD‐L1 was assessed in groups with different driver mutations. The results showed that KRAS‐mutant patients had the significantly highest TPS of PD‐L1, while the other subgroups had weak PD‐L1 expression in general (Figure 5B,D). Of note, EGFR‐mutant nodules had diverse PD‐L1 staining ranging from zero to 30% (Figure 5B,D). We next performed mIF staining in nodules with enough tissues to further analyze the immune features (Figure 6). Consistently, higher expression of PD‐L1 was found in KRAS‐mutant GGO nodules. Conversely, the other groups demonstrated weak or negative staining of PD‐L1 (Figure 6, 1st row). The infiltration of CD4+ T cells was abundant in KRAS‐ and ERBB2‐mutant groups (Figure 6, 2nd row), whereas CD8+ T cells were enriched in EGFR‐ and KRAS‐ mutant groups (Figure 6, 3rd row). FOXP3, a Treg cell marker, was relatively highly expressed in BRAF‐ and EGFR‐mutant GGO nodules, but was negative in KRAS‐, ERBB2‐ and MAP2K1‐mutant GGO nodules (Figure 6, 4th row). Granzyme B released by cytotoxic T cells or NK cells to mediate cell death were weakly expressed across all groups (Figure 6, 5th row). Generally, nodules with KRAS alteration favored a microenvironment with high infiltration of immune cells.
FIGURE 6.
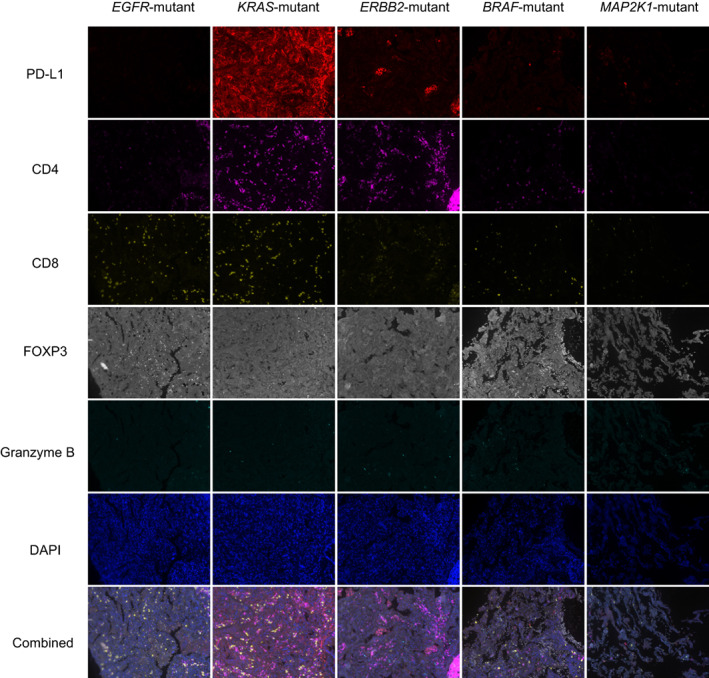
Immune infiltration in pulmonary nodules presenting as GGO. Representative mIF images of PD‐L1, CD4, CD8, FOXP3, Granzyme B, DAPI staining and the merged photos from different driver‐defined groups. mIF staining was performed in three patients for each group. Magnification: ×200 [Color figure can be viewed at wileyonlinelibrary.com]
Previous studies have also revealed that driver gene alterations and immune cell infiltration collectively shape the tumor microenvironment and determine disease recurrence. 22 In our GGO‐associated cohort, only four patients relapsed within 2 years after surgery. All these patients were multi‐nodule patients, with three of them presenting as EGFR‐mutant GGO nodules. Considering that EGFR‐mutant GGO nodules had an increased proliferation ability compared with those with other mutations in RTK/RAS pathway (Figure 5A,C), we assumed that the active growth might lay a foundation for the early recurrence of these patients. To further decide how driver mutations in RTK/RAS pathway affect the survival outcome, patients should be followed up for a longer period.
4. DISCUSSION
In this study, we interrogated the genomic, clinicopathologic, radiologic and immune features of 334 GGO‐associated pulmonary nodules from Chinese patients. We found that RTK/RAS pathway was frequently altered in GGO nodules. The mutually exclusive mutational pattern of EGFR, KRAS, BRAF, ERBB2 and MAP2K1, five driver genes of the RTK/RAS pathway, defined different subgroups of GGO nodules, which showed inter‐group heterogeneity in clinicopathologic and radiologic parameters as well as in immune microenvironment.
Among the 58 patients with multiple pulmonary nodules, 39 patients had no shared mutations in different lesions, which suggested that the multicentric primary tumors could be driven by distinct molecular machinery and therapeutic strategies targeting different oncogenic alterations should be applied in combination. The biological functions of mutations from different lesions converged on RTK/RAS signaling pathway, suggesting that although multiple pulmonary nodules might favor different mutants of tyrosine kinases, constraint and functional selection existed in the evolution trajectories. In addition, 19 patients harbored at least one shared nonsynonymous mutation by multiple nodules from the same patient. The most frequently shared mutation was EGFR p.L858R, which is a known hotspot mutation widely recognized as a recurrent mutation in Asian lung adenocarcinoma. 23 Other rarely shared mutations, including ERBB2 p.Y772_A775dup in P45 and P29, and BRAF p.K601E in P58 suggested the intrapulmonary metastasis or satellite nodules in GGO‐associated lung cancer. 24
Radiologic features have been reported to be related to gene mutation patterns. 25 , 26 , 27 Our study showed that nodules with mutations in ERBB2, BRAF and MAP2K1 preferred to manifesting as pGGO rather than mGGO and were predisposed to indolently behavior. Inversely, EGFR and KRAS mutations were dominant in mGGO nodules or IAC. This phenomenon was consistent with previous studies that nodules with EGFR and KRAS mutations were associated with aggressive behaviors and rapid growth. 5 , 28 , 29 We also found that EGFR‐ and KRAS‐ mutant GGO nodules had higher CTR value, which might be an indicator of mGGO clinically. To date, the in‐depth comparison of radiologic features in longitudinal samples was rare. Therefore, performing dynamic analysis of the radiologic imaging of GGO nodules and establishing its association with genomic data might help identify the GGO nodules at higher risk in the future.
Besides the association with radiologic features, the five driver genes we focused here could also define diverse immune environments. EGFR mutant, which is the most frequent genetic alterations in our GGO cohort, defined a subgroup of GGO nodules harboring high level of CD8+ T cells and Treg cells, which was consistent with a previous study showing high infiltration of Treg cells in EGFR‐mutant GGO nodules. 30 Moreover, we found that KRAS‐mutant lesions showed the highest CD8+ T cell infiltration, which was similar with observations reported previously. 21 , 30 Apart from these well‐established associations, other driver genes which might play a role in shaping the immune environment were investigated. Both ERBB2‐ and MAP2K1‐ mutant GGO nodules demonstrated weak expression of CD8 and FOXP3, whereas BRAF‐mutant GGO nodules were infiltrated by both CD8+ T cells and Treg cells. However, without the gene expression profiling, we could not further validate these findings by bioinformatic algorithms. We also evaluated the PD‐L1 expression which might reflect the efficacy of immunotherapy. KRAS‐mutant nodules had extensively high expression of PD‐L1. Studies reported better immunotherapy efficacy for KRAS‐mutant patients in advanced non‐small‐cell lung cancer treated with PD‐1/PD‐L1 blockade monotherapy. 31 Of note, PD‐L1 was highly expressed in KRAS‐mutant nodules, but weakly or negatively expressed in the other subgroups. This also brought challenges for neoadjuvant immunotherapy in GGO‐associated lung cancers. 32 Two ongoing clinical trials in which anti‐PD1 is being tested as a neoadjuvant therapy for indeterminate pulmonary nodules or GGO nodules (phase II: NCT03634241; pilot study: NCT04047186) initiated 3 years ago. Both trials did not stratify the patients based on their driver mutations. Our data indicated that those patients with RTK/RAS driver mutations might have distinct response to immune checkpoint inhibitors.
Taken together, we identified RTK/RAS signaling pathway as a frequently altered cascade in GGO‐associated pulmonary nodules. EGFR, KRAS, ERBB2, BRAF and MAP2K1, five driver genes in this pathway, defined molecular subtypes with different clinicopathological, radiologic and immune characteristics. Our findings provided molecular underpinning of the diverse clinical phenotypes of GGO‐associated pulmonary nodules.
AUTHOR CONTRIBUTIONS
Fenglei Yu: conceptualization, methodology, investigation, funding acquisition, writing—original draft. Muyun Peng: methodology, validation, data curation, writing—original draft. Jing Bai: methodology, software, formal analysis, resources, visualization. Xiuli Zhu: formal analysis, investigation. Bingyu Zhang: visualization, investigation. Jingqun Tang: resources, investigation. Wenliang Liu: formal analysis, writing—original draft. Chen Chen: writing—original draft. Xiang Wang: visualization, data curation. Mingjiu Chen: data curation, resources. Sichuang Tan: data curation, resources. Yi Sun: resources, validation. Qingchun Liang: investigation. Jina Li: software, resources. Yan Hu: investigation, validation. Aihui Liao: investigation. Huali Hu: visualization. Yu He: visualization, investigation. Xiao Xiao: writing—review & editing. Bin Wang: funding acquisition, writing—review & editing. Guanlan Xing: writing—review & editing. Yaping Xu: writing—review & editing. Rongrong Chen: writing—review & editing. Xuefeng Xia: writing—review & editing. Xiaofeng Chen: conceptualization, investigation, supervision, writing—review & editing. The work reported in the paper has been performed by the authors, unless clearly specified in the text.
CONFLICT OF INTEREST
The authors declare no conflict of interest.
ETHICS STATEMENT
This study was reviewed and approved by the Ethics Committee of the Second Xiangya Hospital of Central South University. All participating patients signed written informed consent.
Supporting information
APPENDIX S1 Supporting information
ACKNOWLEDGEMENTS
We thank the patients and their families for their contributions to this study. We also thank the editors and the reviewers for their valuable suggestions. This work was supported by the National Natural Science Foundation of China (81972195 to Dr. Fenglei Yu), Hunan Provincial Key Area R&D Program (2019SK2253 to Dr. Fenglei Yu), and Hunan Provincial Key Area R&D Program (2021SK2020 to Dr. Bin Wang).
Yu F, Peng M, Bai J, et al. Comprehensive characterization of genomic and radiologic features reveals distinct driver patterns of RTK/RAS pathway in ground‐glass opacity pulmonary nodules. Int J Cancer. 2022;151(11):2020‐2030. doi: 10.1002/ijc.34238
Fenglei Yu, Muyun Peng and Jing Bai have contributed equally to this study.
The abstract of the manuscript has been accepted as oral presentation for the 2021 ASCO Annual Meeting numbered e20516 in Journal of Clinical Oncology.
Funding information Hunan Provincial Key Area R&D Program, Grant/Award Numbers: 2019SK2253, 2021SK2020; National Natural Science Foundation of China, Grant/Award Number: 81972195
DATA AVAILABILITY STATEMENT
The data that support the findings of this study are available from the corresponding authors upon reasonable request.
REFERENCES
- 1. Bray F, Ferlay J, Soerjomataram I, Siegel RL, Torre LA, Jemal A. Global cancer statistics 2018: GLOBOCAN estimates of incidence and mortality worldwide for 36 cancers in 185 countries. CA Cancer J Clin. 2018;68:394‐424. [DOI] [PubMed] [Google Scholar]
- 2. Cheng TY, Cramb SM, Baade PD, Youlden DR, Nwogu C, Reid ME. The international epidemiology of lung cancer: latest trends, disparities, and tumor characteristics. J Thorac Oncol. 2016;11:1653‐1671. [DOI] [PMC free article] [PubMed] [Google Scholar]
- 3. Aberle DR, Adams AM, Berg CD, et al. Reduced lung‐cancer mortality with low‐dose computed tomographic screening. N Engl J Med. 2011;365:395‐409. [DOI] [PMC free article] [PubMed] [Google Scholar]
- 4. de Koning HJ, van der Aalst CM, de Jong PA, et al. Reduced lung‐cancer mortality with volume CT screening in a randomized trial. N Engl J Med. 2020;382:503‐513. [DOI] [PubMed] [Google Scholar]
- 5. Li Y, Li X, Li H, et al. Genomic characterisation of pulmonary subsolid nodules: mutational landscape and radiological features. Eur Respir J. 2020;55:1901409. [DOI] [PubMed] [Google Scholar]
- 6. Detterbeck FC, Homer RJ. Approach to the ground‐glass nodule. Clin Chest Med. 2011;32:799‐810. [DOI] [PubMed] [Google Scholar]
- 7. Pedersen JH, Saghir Z, Wille MM, Thomsen LH, Skov BG, Ashraf H. Ground‐glass opacity lung nodules in the era of lung cancer CT screening: radiology, pathology, and clinical management. Oncology. 2016;30:266‐274. [PubMed] [Google Scholar]
- 8. Hirsch FR, Scagliotti GV, Mulshine JL, et al. Lung cancer: current therapies and new targeted treatments. Lancet. 2017;389:299‐311. [DOI] [PubMed] [Google Scholar]
- 9. Campbell JD, Alexandrov A, Kim J, et al. Distinct patterns of somatic genome alterations in lung adenocarcinomas and squamous cell carcinomas. Nat Genet. 2016;48:607‐616. [DOI] [PMC free article] [PubMed] [Google Scholar]
- 10. Chen H, Carrot‐Zhang J, Zhao Y, et al. Genomic and immune profiling of pre‐invasive lung adenocarcinoma. Nat Commun. 2019;10:5472. [DOI] [PMC free article] [PubMed] [Google Scholar]
- 11. Zhou J, Sanchez‐Vega F, Caso R, et al. Analysis of tumor genomic pathway alterations using broad‐panel next‐generation sequencing in surgically resected lung adenocarcinoma. Clin Cancer Res. 2019;25:7475‐7484. [DOI] [PMC free article] [PubMed] [Google Scholar]
- 12. Hu X, Fujimoto J, Ying L, et al. Multi‐region exome sequencing reveals genomic evolution from preneoplasia to lung adenocarcinoma. Nat Commun. 2019;10:2978. [DOI] [PMC free article] [PubMed] [Google Scholar]
- 13. Cao P, Hu S, Kong K, et al. Genomic landscape of ground glass opacities (GGOs) in east Asians. J Thorac Dis. 2021;13:2393‐2403. [DOI] [PMC free article] [PubMed] [Google Scholar]
- 14. Chen Y, Chen G, Li J, et al. Association of tumor protein p53 and ataxia‐telangiectasia mutated comutation with response to immune checkpoint inhibitors and mortality in patients with non‐small cell lung cancer. JAMA Netw Open. 2019;2:e1911895. [DOI] [PMC free article] [PubMed] [Google Scholar]
- 15. Lin G, Li C, Li PS, et al. Genomic origin and EGFR‐TKI treatments of pulmonary adenosquamous carcinoma. Ann Oncol. 2020;31:517‐524. [DOI] [PubMed] [Google Scholar]
- 16. Detterbeck FC, Boffa DJ, Kim AW, Tanoue LT. The eighth edition lung cancer stage classification. Chest. 2017;151:193‐203. [DOI] [PubMed] [Google Scholar]
- 17. Chen K, Bai J, Reuben A, et al. Multiomics analysis reveals distinct immunogenomic features of lung cancer with ground‐glass opacity. Am J Respir Crit Care Med. 2021;204:1180‐1192. [DOI] [PMC free article] [PubMed] [Google Scholar]
- 18. Ma P, Fu Y, Cai MC, et al. Simultaneous evolutionary expansion and constraint of genomic heterogeneity in multifocal lung cancer. Nat Commun. 2017;8:823. [DOI] [PMC free article] [PubMed] [Google Scholar]
- 19. El Tekle G, Bernasocchi T, Unni AM, et al. Co‐occurrence and mutual exclusivity: what cross‐cancer mutation patterns can tell us. Trends Cancer. 2021;7:823‐836. [DOI] [PubMed] [Google Scholar]
- 20. Skoulidis F, Heymach JV. Co‐occurring genomic alterations in?Non‐small‐cell lung cancer biology and therapy. Nat Rev Cancer. 2019;19:495‐509. [DOI] [PMC free article] [PubMed] [Google Scholar]
- 21. Zhang XC, Wang J, Shao GG, et al. Comprehensive genomic and immunological characterization of Chinese non‐small cell lung cancer patients. Nat Commun. 2019;10:1772. [DOI] [PMC free article] [PubMed] [Google Scholar]
- 22. Wu F, Fan J, He Y, et al. Single‐cell profiling of tumor heterogeneity and the microenvironment in advanced non‐small cell lung cancer. Nat Commun. 2021;12:2540. [DOI] [PMC free article] [PubMed] [Google Scholar]
- 23. Mok TS, Wu YL, Thongprasert S, et al. Gefitinib or carboplatin‐paclitaxel in pulmonary adenocarcinoma. N Engl J Med. 2009;361:947‐957. [DOI] [PubMed] [Google Scholar]
- 24. Liu Y, Zhang J, Li L, et al. Genomic heterogeneity of multiple synchronous lung cancer. Nat Commun. 2016;7:13200. [DOI] [PMC free article] [PubMed] [Google Scholar]
- 25. Aerts HJ, Velazquez ER, Leijenaar RT, et al. Decoding tumour phenotype by noninvasive imaging using a quantitative radiomics approach. Nat Commun. 2014;5:4006. [DOI] [PMC free article] [PubMed] [Google Scholar]
- 26. Gevaert O, Xu J, Hoang CD, et al. Non‐small cell lung cancer: identifying prognostic imaging biomarkers by leveraging public gene expression microarray data: methods and preliminary results. Radiology. 2012;264:387‐396. [DOI] [PMC free article] [PubMed] [Google Scholar]
- 27. Zhou M, Leung A, Echegaray S, et al. Non‐small cell lung cancer radiogenomics map identifies relationships between molecular and imaging phenotypes with prognostic implications. Radiology. 2018;286:307‐315. [DOI] [PMC free article] [PubMed] [Google Scholar]
- 28. Rekhtman N, Ang DC, Riely GJ, Ladanyi M, Moreira AL. KRAS mutations are associated with solid growth pattern and tumor‐infiltrating leukocytes in lung adenocarcinoma. Mod Pathol. 2013;26:1307‐1319. [DOI] [PMC free article] [PubMed] [Google Scholar]
- 29. Kobayashi Y, Ambrogio C, Mitsudomi T. Ground‐glass nodules of the lung in never‐smokers and smokers: clinical and genetic insights. Transl Lung Cancer Res. 2018;7:487‐497. [DOI] [PMC free article] [PubMed] [Google Scholar]
- 30. Dejima H, Hu X, Chen R, et al. Immune evolution from preneoplasia to invasive lung adenocarcinomas and underlying molecular features. Nat Commun. 2021;12:2722. [DOI] [PMC free article] [PubMed] [Google Scholar]
- 31. Liu C, Zheng S, Jin R, et al. The superior efficacy of anti‐PD‐1/PD‐L1 immunotherapy in KRAS‐mutant non‐small cell lung cancer that correlates with an inflammatory phenotype and increased immunogenicity. Cancer Lett. 2020;470:95‐105. [DOI] [PubMed] [Google Scholar]
- 32. Wu F, Li W, Zhao W, et al. Synchronous ground\glass nodules showed limited response to anti\PD\1/PD\L1 therapy in patients with advanced lung adenocarcinoma. Clin Transl Med. 2020;10:e149. [Google Scholar]
Associated Data
This section collects any data citations, data availability statements, or supplementary materials included in this article.
Supplementary Materials
APPENDIX S1 Supporting information
Data Availability Statement
The data that support the findings of this study are available from the corresponding authors upon reasonable request.