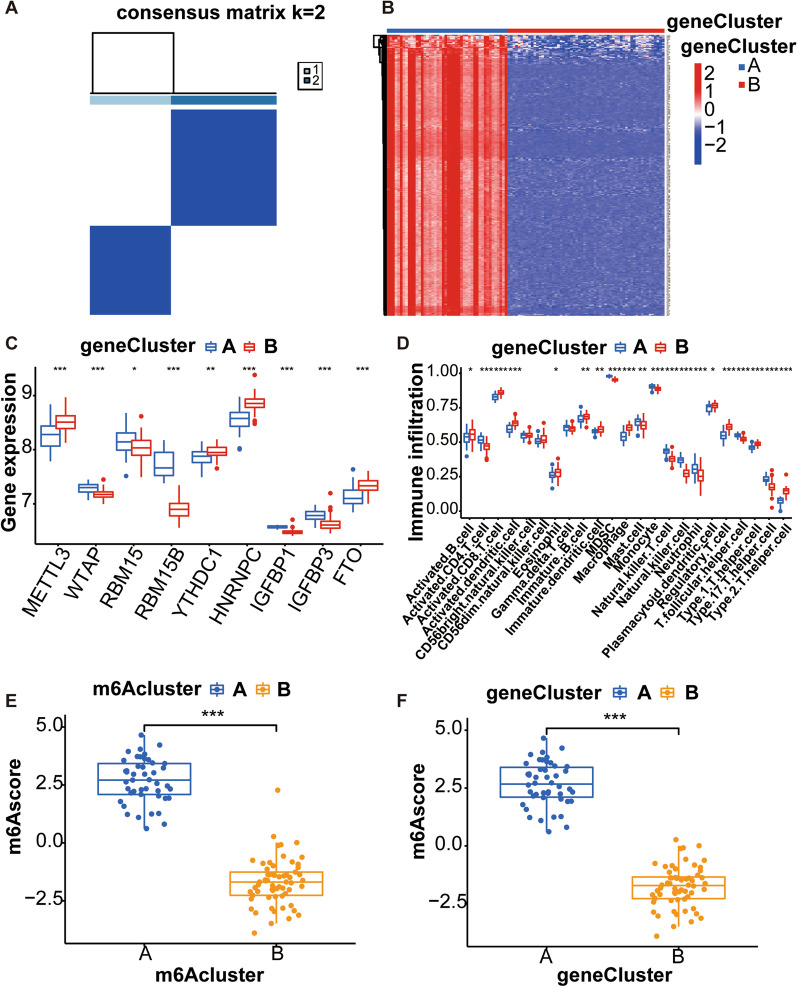
Fig. 8.
The consensus clustering analysis of DEGs between both m6A isoforms. A Consensus clustering analysis separates osteoarthritis patient samples into two genotypes; B Heatmap showing differential expression of these 302 genes in two genotypes; C Histograms showing differential expression of 9 key m6A regulators between two gene isoforms; D Histograms displaying differences in the immune infiltration between both genotypes; E Differences of the m6A scores of both m6A subtypes; F Differences in m6A scores of the two gene subtypes. *p < 0.05, **p < 0.01, and ***p < 0.001

