Fig. 3.

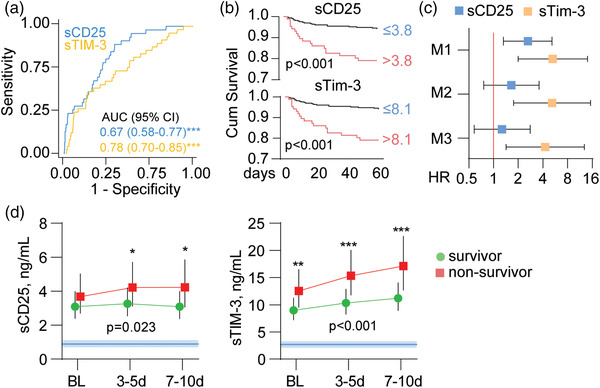
sCD25 and sTim‐3 and 60‐day mortality in severe COVID‐19. (a) Receiver operating characteristic (ROC) analysis of admission levels of sCD25 and sTim‐3 in relation to 60‐day mortality, (b) Kaplan–Meier analysis of 60‐day mortality (n = 31) according to dichotomized admission levels of sCD25 (Youden's index cut off: 3.8 ng/ml) and sTim‐3 (Youden's index cut off: 8.1 ng/ml). (c) Cox regression of admission levels of sCD25 and sTim‐3 (dichotomized according to Youden's index as in b) in relation to 60‐day mortality with different levels of adjustment (M1: age, COVID wave, and dexamethasone treatment; M2: M1 + chronic cardiac and pulmonary disease, neutrophil count and lymphocyte count, and estimated glomerular filtration rate; M3: M2 + C‐reactive protein). (d) Temporal profile of sCD25 and sTim‐3 during the first 10 days after admission according to 60‐day mortality shown as estimated marginal means and 95% confidence intervals (CI) with adjustment for M2 from c. The p‐values reflect the group (outcome) effect from the linear mixed models. Blue areas reflect reference ranges from 21 healthy controls. **p < 0.01, ***p < 0.001 between groups.
