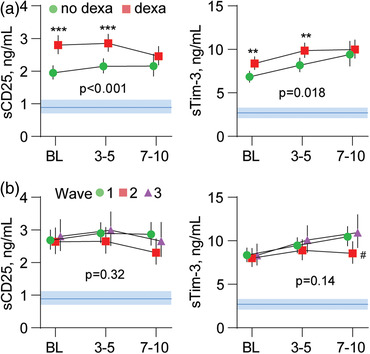
Fig. 4.

Temporal profile of sCD25 and sTim‐3 according to (a) dexamethasone treatment and (b) COVID‐19 wave, shown. The p‐values reflect the group (outcome) effect from the linear mixed models. Data are presented as estimated marginal means and 95% confidence intervals (CI) in age‐ and sex‐adjusted analysis. Blue areas reflect reference ranges from 21 healthy controls. **p < 0.01, ***p < 0.001 between groups; #p < 0.05 versus waves 1 and 3.
