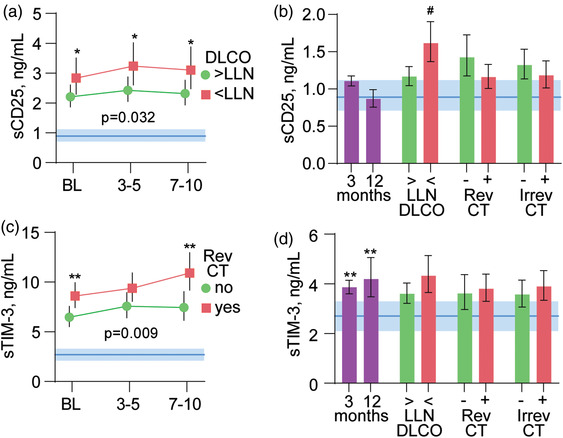
Fig. 5.

sCD25 and sTim‐3 at follow‐up and in relation to pulmonary pathology. Temporal profile of (a) sCD25 and (c) sTim‐3 during the first 10 days after admission according to impaired diffusing capacity of the lungs for carbon monoxide (DLCO, above or below the lower limit of normal [LLN]) or reversible (Rev) or irreversible (Irrev) computed tomography (CT) changes at 3‐month follow‐up. The p‐values reflect the group (outcome) effect from the linear mixed models adjusting for randomized treatment, age, sex, and neutrophil counts. Blue areas in panels a and c reflect the reference value range. *p < 0.05, **p < 0.01 between groups. Panels b and d (left part) show levels of sCD25 (b) and sTim‐3 (d) at 3 and 12 months (n = 257) compared with healthy controls (n = 21). The right parts of panels b and d show levels of sCD25 (b) and sTim‐3 (d) at 3 months in relation to DLCO below or above LLN and reversible and irreversible CT changes at 3 months. #p < 0.01 versus DLCO < LLN.
