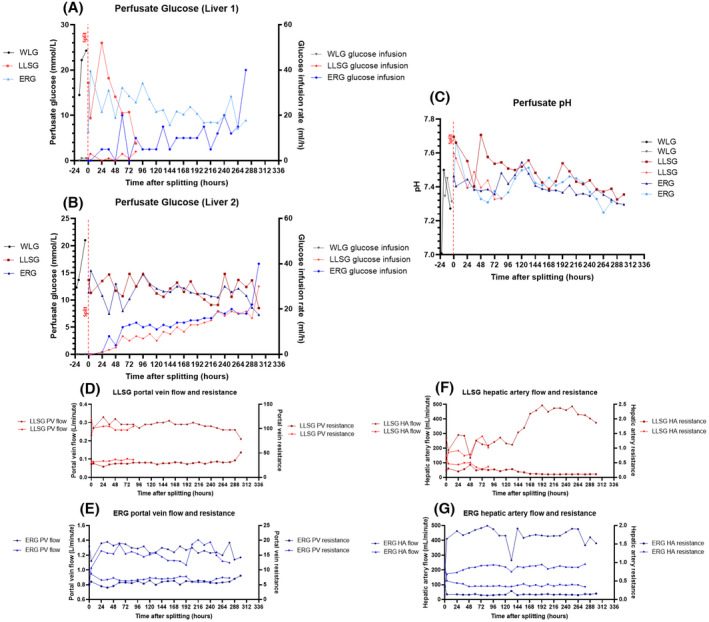
FIGURE 3.

Evidence of worsening liver function at the end of perfusion during long‐term ex situ machine perfusion of human livers. (A and B) For all livers (A: Liver 1, B: Liver 2) and all partial grafts, perfusate glucose levels remained stable during long‐term perfusion sustained on infusions of glucose and glucagon. Towards the end of perfusion, there was a trend towards hypoglycemia with a corresponding increasing glucose requirement until the liver failed. (C) Perfusate pH was neutral or alkalotic throughout perfusion until the end of perfusion where acidosis predominated and was unresponsive to treatment. (D and E) Portal vein flow and corresponding resistance in the left lateral segment grafts (LLSG) (D) and extended right grafts (ERG) (E) remained stable until the end of perfusion where there was an increase in vascular resistance and a corresponding decrease in portal vein flow. (F and G) Hepatic artery flow and resistance in the left lateral segment grafts (F) and extended right grafts (G) remained stable during perfusion. There was an increase in hepatic artery flow in the left lateral segment graft towards the end of the perfusion. [Color figure can be viewed at wileyonlinelibrary.com]
