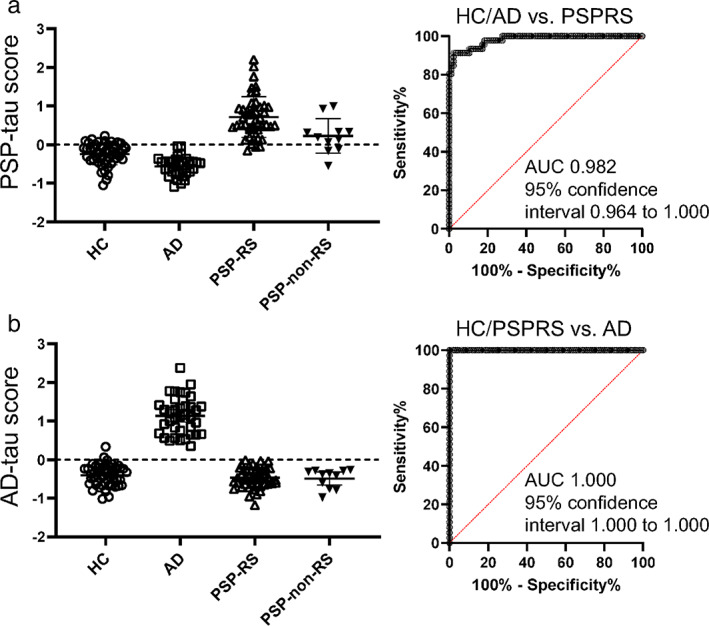
FIG 2.

Plots of PSP‐tau score and AD‐tau score in each group and AUC for the ROC analysis. (A) Figure plotted with PSP‐tau score on the vertical axis and HC (circle), AD (square), PSP‐RS (triangle), and PSP‐non‐RS (filled reverse triangle) on the horizontal axis. The dotted line indicates the zero line. The rightmost group shows the weighting coefficients trained on HC+ AD and PSP‐RS, which were also applied to PSP‐non‐RS. (B) The vertical axis is AD‐tau score; the horizontal axis shows HC, AD, PSP‐RS, and non‐PSP‐RS as in (A), respectively. The dotted line indicates the zero line. In the rightmost group, the weighting coefficients trained for HC + PSP‐RS and AD were also applied to PSP‐non‐RS. AD, Alzheimer's disease; AUC, area under the curve; HC, healthy control; PSP, progressive supranuclear palsy; PSP‐non‐RS, progressive supranuclear palsy without Richardson's syndrome; PSP‐RS, progressive supranuclear palsy–Richardson's syndrome; ROC, receiver operating characteristic. [Color figure can be viewed at wileyonlinelibrary.com]
