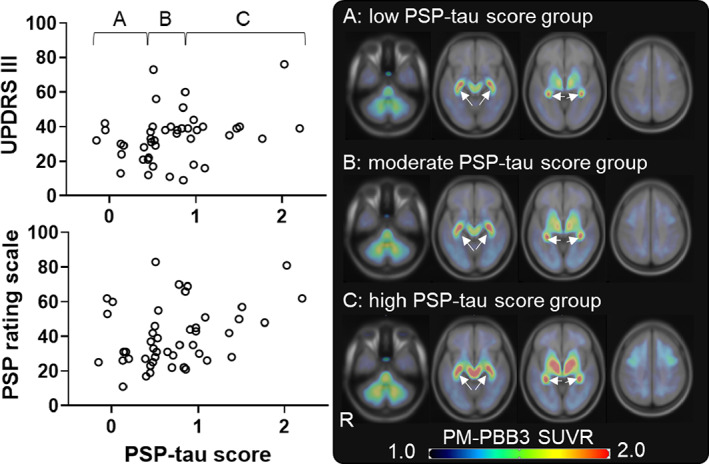
FIG 4.

Correlation between PSP‐tau score and clinical score in PSP‐RS group. The upper left scatterplot shows the PSP‐RS group (open circles) with UPDRS III on the vertical axis and PSP‐tau score on the horizontal axis. The higher the score, the worse is UPDRS III. The lower left scatterplot shows the PSP‐RS group (open circle) with PSP rating scale on the vertical axis and PSP‐tau score on the horizontal axis. The higher the score, the worse is the PSP rating scale. The figure on the right shows the mean SUVR images of each group on the standard brain, equally divided into low PSP‐tau score group A (n = 15), moderate PSP‐tau score group B (n = 15), and high PSP‐tau score group C (n = 16) (A, B, and C correspond to the letters in the upper left scatterplot, respectively). The images are shown in axial sections from left to right in Montreal Neurologic Institute coordinates −36, −12, −4, and 41, respectively. Arrows indicate nonspecific accumulation in the choroid plexus. HC, healthy control; PSP, progressive supranuclear palsy; PSP‐RS, progressive supranuclear palsy–Richardson's syndrome; SUVR, standardized uptake value ratio; UPDRS III, Unified Parkinson's Disease Rating Scale Part III. [Color figure can be viewed at wileyonlinelibrary.com]
