FIGURE 4.

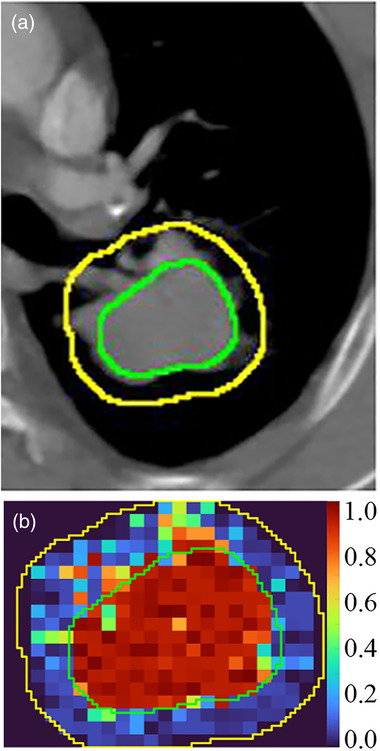
The CT images (a) and corresponding svfeature map (b). Green lines indicate gross target volume (GTV) defined by radiologists, and yellow lines denote the peritumoral region

The CT images (a) and corresponding svfeature map (b). Green lines indicate gross target volume (GTV) defined by radiologists, and yellow lines denote the peritumoral region