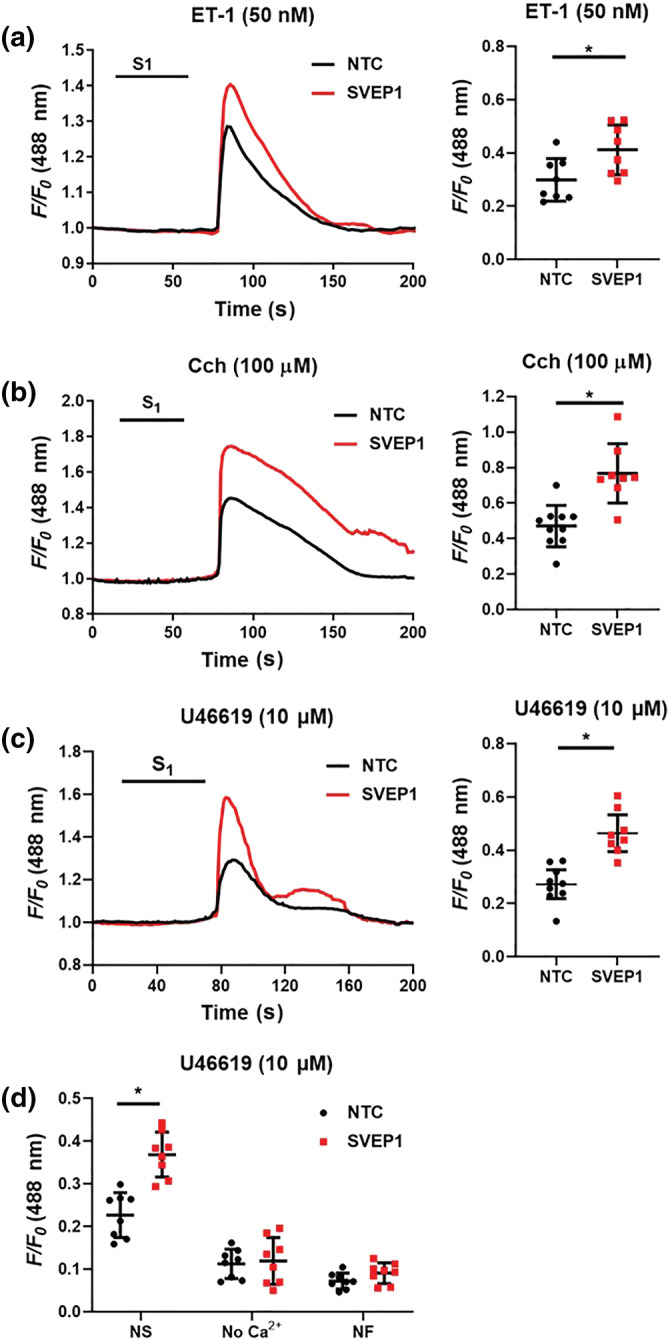
FIGURE 3.

SVEP1 inhibition increases iVSMC [Ca2+]i to different vasoconstrictors. iVSMCs were treated with either non‐targeting control (NTC), or SVEP1 siRNA for 48 h prior to Fluo3 loading and vasoconstrictor challenge for 45 s (S1). (a) Mean trace and maximal fluorescence signal (dot plot, F/F0) are shown for ET‐1 (50 nM, n = 8), (b) carbachol (Cch; 100 μM), NTC n = 10, SVEP1 n = 8, and (c) U46619 (10 μM, n = 8). (d) Imaging buffer was changed to a zero Ca2+ buffer (no Ca2+) for 2 min, or incubated in nifedipine (NF, 3 μM) for 30 min prior to U46619 challenge (10 μM, n = 8); NS, non‐stimulated control. Data presented are individual values with means ± SD. *P < 0.05, significantly different as indicated; unpaired t test.
