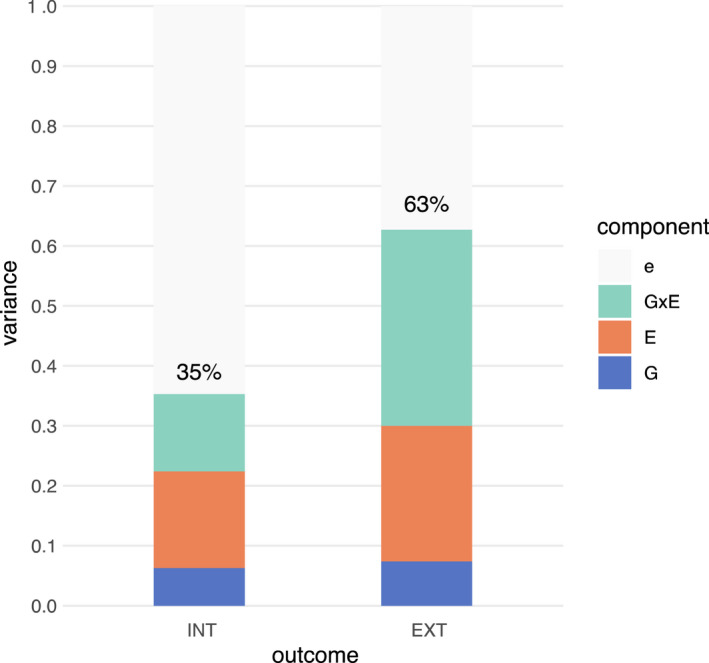
Figure 1.

Estimated total proportion of variance in INT and EXT symptoms explained by G, E, and G × E components. e, residual variance; E, modeled exposome effects based on 133 exposure variables; G, genomic effects; G × E, genome‐by‐exposome effects [Colour figure can be viewed at wileyonlinelibrary.com]
