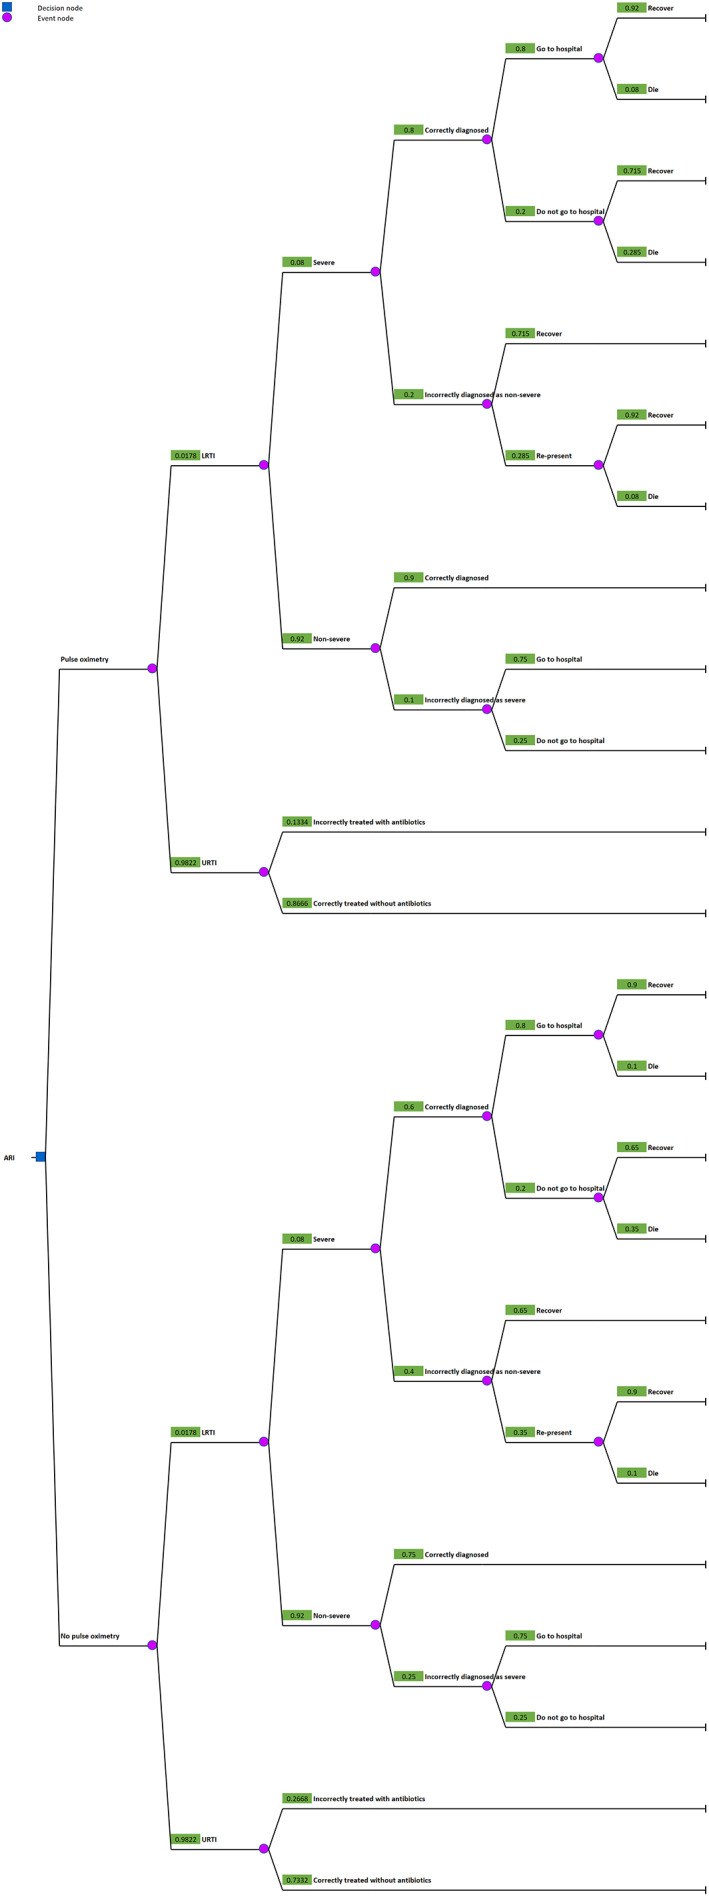
FIGURE 2.

Decision tree model structure. Parameters are shown in Table 2. The numbers next to event nodes indicate the probabilities of each event in children <5 years in the main analysis. Decision trees with probabilities relevant to other age groups can be found in Supporting Information S2. ARI, acute respiratory infection; LRTI, lower respiratory tract infection; URTI, upper respiratory tract infection
