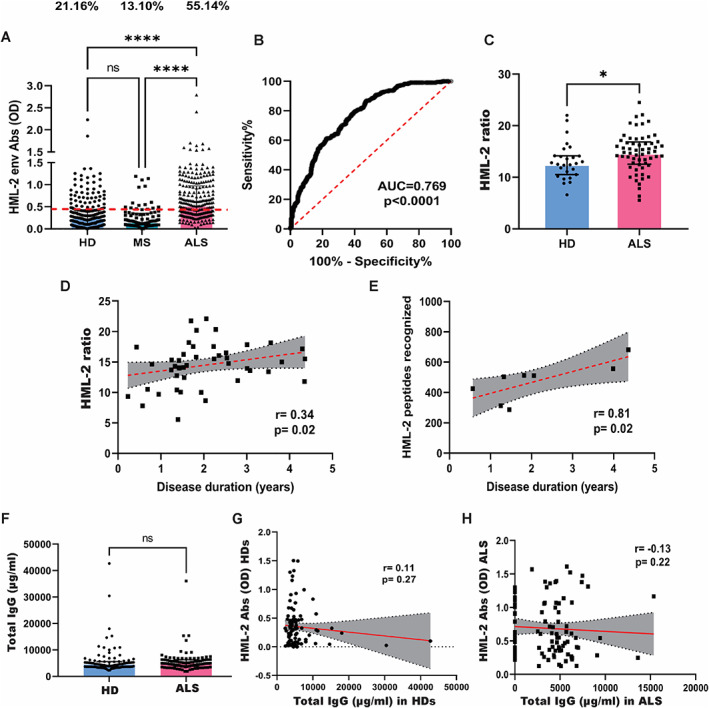
FIGURE 2.

HML‐2 levels and antibodies against a select HML‐2 env peptide. (A) Comparison of levels of antibodies to a select HML‐2 peptide determined by enzyme‐linked immunosorbent assay (ELISA) in healthy donors (HD) (n = 242), individuals with amyotrophic lateral sclerosis (ALS) (n = 243) and in multiple sclerosis (MS) (n = 85) (Kruskal–Wallis test with Dunn post‐hoc test; ****p < 0.0001) and comparison of percentage of positive individuals. Red dashed line represents the threshold used to assess the samples' positivity (Fisher exact test; p < 0.0001). (B) ROC curve between sensitivity and specificity of the HML‐2 antibody ELISA test for every possible cutoff. The area under the ROC curve (AUC) is a measure of the diagnostic test accuracy (AUC = 0.769; p < 0.0001). (C) HML‐2 ratio (HML‐2 env copies/RPP30 copies) in individuals with ALS (n = 60) and HDs (n = 27) as determined by digital PCR (Mann–Whitney; *p = 0.02). (D) Correlation between disease duration and HML‐2 ratio in ALS patients (with duration <5 years) (n = 54; Spearman's r = 0.34; p = 0.02). (E) Correlation between the number of peptides recognized and the disease duration in individuals with ALS (with duration <5 years) (n = 8; Spearman's r = 0.81; p = 0.02). (F) Levels of total IgG antibodies as determined by ELISA in HDs (n = 100) and individuals with ALS (n = 100) (Mann–Whitney; p = 0.19). (G) Correlation between concentration of total IgG antibodies and levels of HML‐2 antibodies in the serum of HDs (n = 99; Spearman r = 0.11; p = 0.27). (H) Correlation between concentration of total IgG antibodies and levels of HML‐2 antibodies in the serum of individuals with ALS (n = 99; Spearman r = −0.13; p = 0.22). [Color figure can be viewed at www.annalsofneurology.org]
