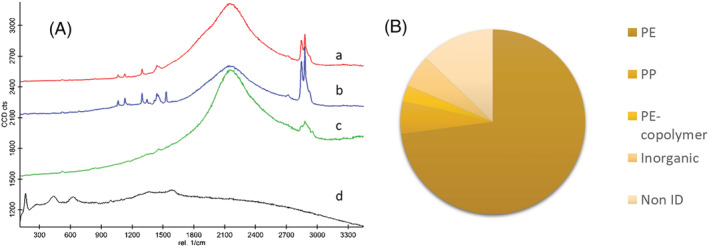
FIGURE 2.

Results of Raman spectroscopic analysis of wMP particles: (A) representative Raman spectra of wMPs identified as (a) PE (red line), (b) PE containing phthalocyanine blue (blue line), (c) PP (green line), (d) particles containing TiO2 (black line). (B) Chemical composition of the analysed particles
