
FIGURE 6.
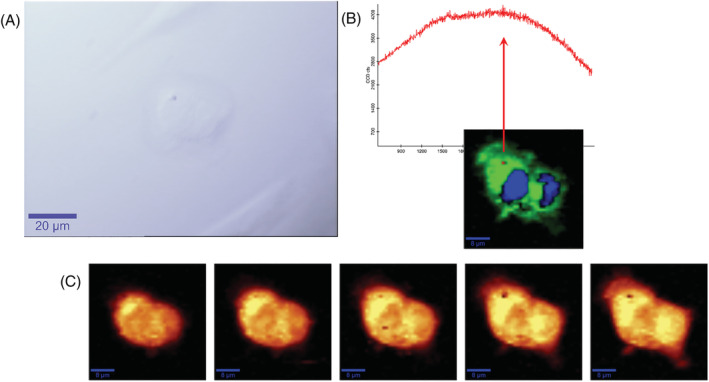
μRaman microscopic mapping of cells. (A) Optical image (60X water immersion objective, scale bar 20 μm); (B) Raman spectra of wMPs (up, red line) and false colour chemical image of cells (down, green cytoplasm and blue nuclei); (C) intensity map of the C‐H stretching vibration spectral region, Z stack of a 5 μm thick slice (scale bar 10 μm)