
Fig. 2.
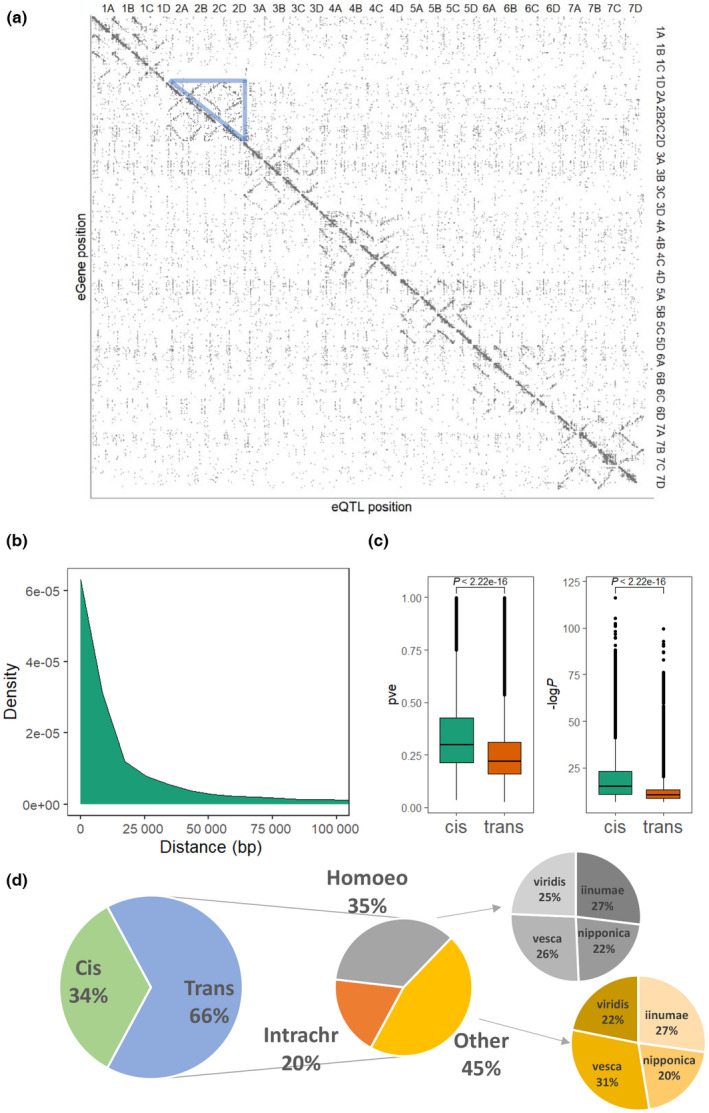
Genome‐wide characterization of expression quantitative trait loci (eQTL) in strawberry (Fragaria × ananassa). (a) The lead marker positions of eQTL are plotted against the middle positions of mapped eGenes. Each dot represents a significant eQTL. The grayscale of the dot reflects the −logP value. The blue triangle highlights homoeologous trans‐eQTL on chromosomes 2A to 2D. (b) Density plot of minimum distance between significant cis‐eQTL markers and their associated eGenes. (c) Box plots comparing proportions of phenotypic variance explained by lead markers (pve, left) and −logP (right) between cis‐ and trans‐eQTL. Boxes are delimited by upper and lower quantiles. Two whiskers represent highest/lowest values; dots represent outliers; and horizontal lines represent medians. (d) Proportions of cis‐eQTL and trans‐eQTL. Trans‐eQTL are categorized into homoeologous trans‐eQTL (homoeo), intrachromosomal trans‐eQTL (intrachr) and other trans‐eQTL. Homoeologous trans‐eQTL/other trans‐eQTL are further divided into four groups according to their subgenome ancestry.