Fig. 5.

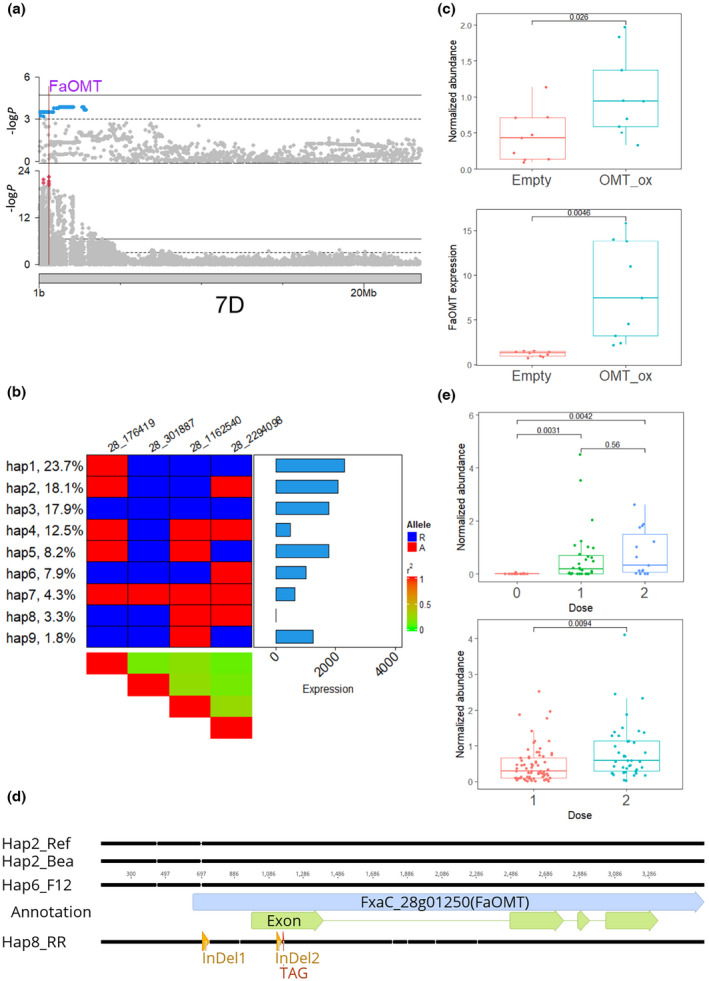
Genetic analysis of mesifurane in strawberry (Fragaria × ananassa). (a) Manhattan plots of genome‐wide association study (GWAS) results for mesifurane (upper panel) and expression quantitative trait loci (eQTL) results for FaOMT (lower panel) on choromosome 7D. The physical position of FaOMT is marked with a vertical line. Blue dots represent all significant markers in mesifurane GWAS results and red dots represent top five makers of FaOMT eQTL. (b) Nine haplotypes of FaOMT identified with four unlinked significant markers (r 2 < 0.5). Markers were named according to chrID_position. Left annotation shows haplotype frequency. Right annotation shows haplotype effect in unit of normalized count. The central heatmap shows marker genotype. Blue represents the reference allele; red represents the alternative allele. (c) Transient overexpression of FaOMT in strawberry fruit. Upper panel shows normalized abundance of mesifurane in fruits agroinfiltrated with either FaOMT overexpression construct (blue) or pMDC32 control (red). Lower panel shows FaOMT expression quantified with quantitative (q)PCR. Boxes are delimited by upper and lower quantiles. Two whiskers represent highest/lowest values; dots represent individual values; and horizontal lines represent medians. (d) Alignment among four haplotypes of FaOMT. Two haplotype 2s are from the reference genome and the Bea haploid assembly. Haplotype 6 is derived from the F12 haploid assembly. The nonfunctional haplotype 8 is from the ‘Royal Royce’ assembly. (e) Functional high‐resolution melting marker tested in selected breeding lines (upper) and a test cross (lower). The normalized abundance of mesifurane is plotted with the dosage of functional allele of FaOMT. A significant gene dosage effect was observed in the test cross. Box plot annotations are the same as for plot (c).
