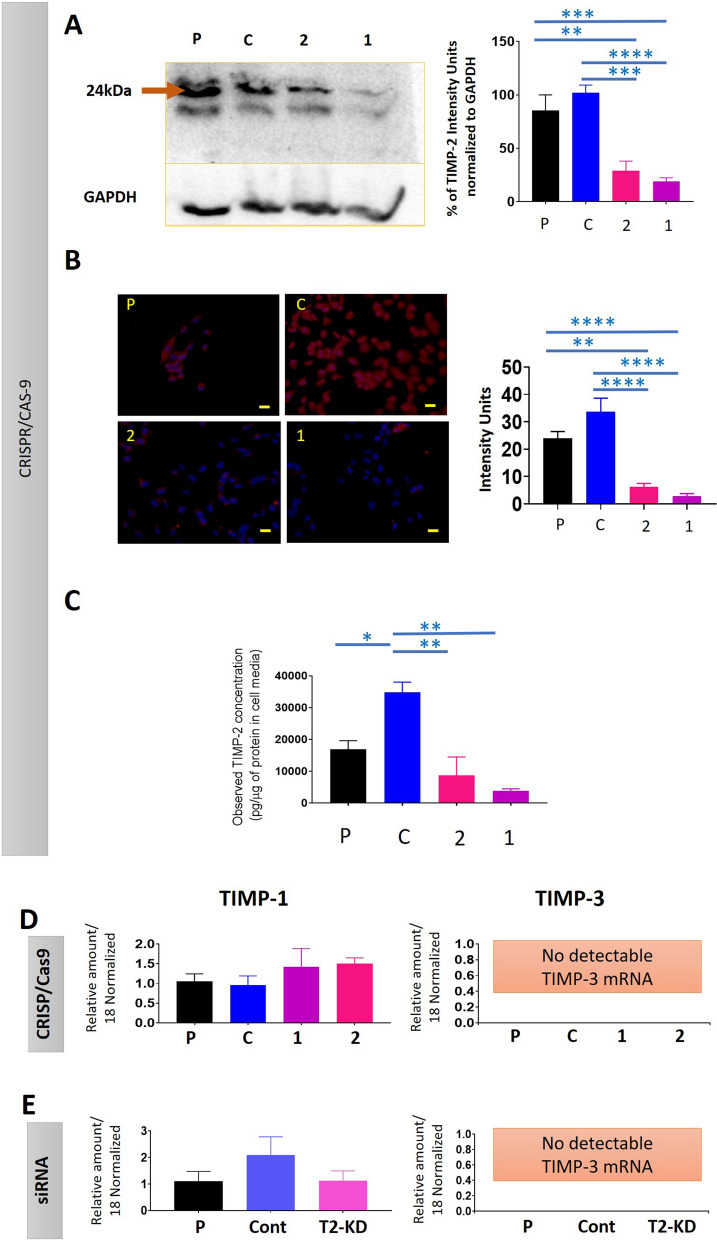
Fig. 2.
Expression of TIMP-2 and other TIMPs in response to TIMP-2 suppression by CRISPR/Cas9 and siRNA in OVCAR5 cell line. Cell lines studied are P—Parental; C—CRISPR control; 2—gRNA2, 1—gRNA1 cell lines; Cont-siRNA control, T2-KD-TIMP-2 siRNA knocked down and P, parental lipofectamine only treated control cells. A Expression of cellular TIMP-2 by Western blot in parental and CRISPR/Cas9 treated cell lines. Representative image of a Western blot of TIMP-2 and GAPDH proteins on the cell lysates of the respective cell lines. The additional cross-reactive bands observed are indicated in manufacture’s information. Graphs indicates densitometry intensity units of TIMP-2 protein bands normalized to GAPDH protein. The data presented is a mean of three independent experiments. Values are mean ± SEM. Significance was obtained using One-way ANOVA. **p < 0.01, ***p < 0.001, ****p < 0.0001 when compared to the control and parental cell lines. B Expression of cellular TIMP-2 by immunofluorescence in CRISPR/Cas9 treated, control and parental cell lines. Images are representations of merged DAPI (blue) and TIMP-2 (red) staining of individual cell lines performed in three independent experiments, in triplicate. ×40 magnification; scale bar (in yellow) 40 µM. Graphs indicates the intensity of fluorescence obtained using FIJI software as described in “Methods”. Significance was obtained using One-way ANOVA. C Secreted TIMP-2 protein in CRISPR/Cas9 treated, control and parental cell lines. The expression of secreted TIMP-2 in cell conditioned medium was deduced by ELISA as described in “Methods”. Results are expressed as total TIMP-2 secreted protein (pg/µg of protein in cell medium). Values are mean ± SEM and each bar graph represents n = 3 for each cell line collected in three independent experiments. Significance was obtained using One-way ANOVA *p < 0.05, **p < 0.01, and ****p < 0.0001 when compared to the control cell line and parental cell line. D, E mRNA expression of TIMP-1 and TIMP-3 in siRNA-mediated TIMP-2 suppressed cells. mRNA expression of TIMP-1 and TIMP-3 was deduced by qRT-PCR as described in “Methods”. Values are mean ± SEM and each bar graph represents n = 3 for each cell line collected in three independent experiments

