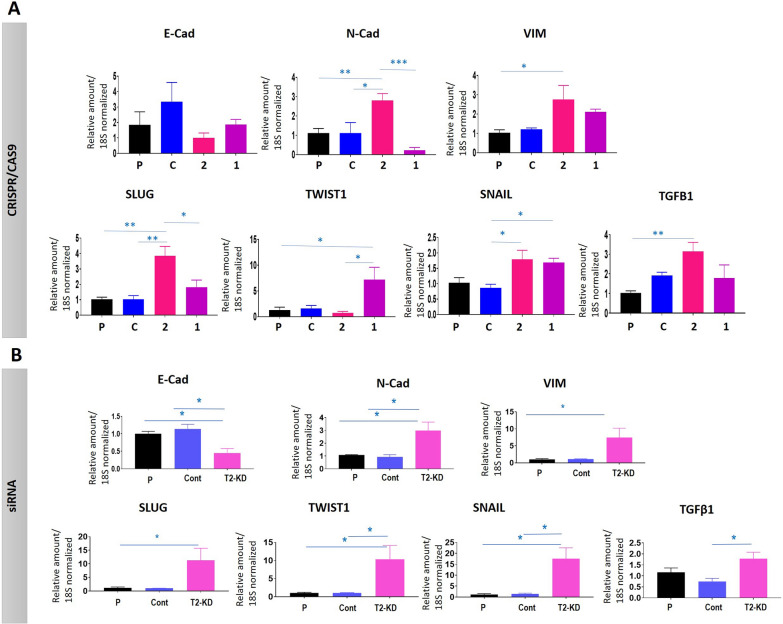
Fig. 4.
Effect of TIMP-2 suppression by A CRISPR/Cas9 and B siRNA methods on the mRNA expression of EMT-associated genes in OVCAR5 cells. The cell lines/cells are described in Fig. 3. A, B The mRNA expression of E-Cad, N-Cad, VIM, SLUG, TWIST1, SNAIL and TGFβ1 deduced by qRT-PCR. Values are mean ± SEM and each bar graph represents n = 3 for each cell line collected in independent experiments. Significance was obtained using One-way ANOVA. *p < 0.05, **p < 0.01, ***p < 0.001, ****p < 0.0001 when compared to the control and parental cell lines

