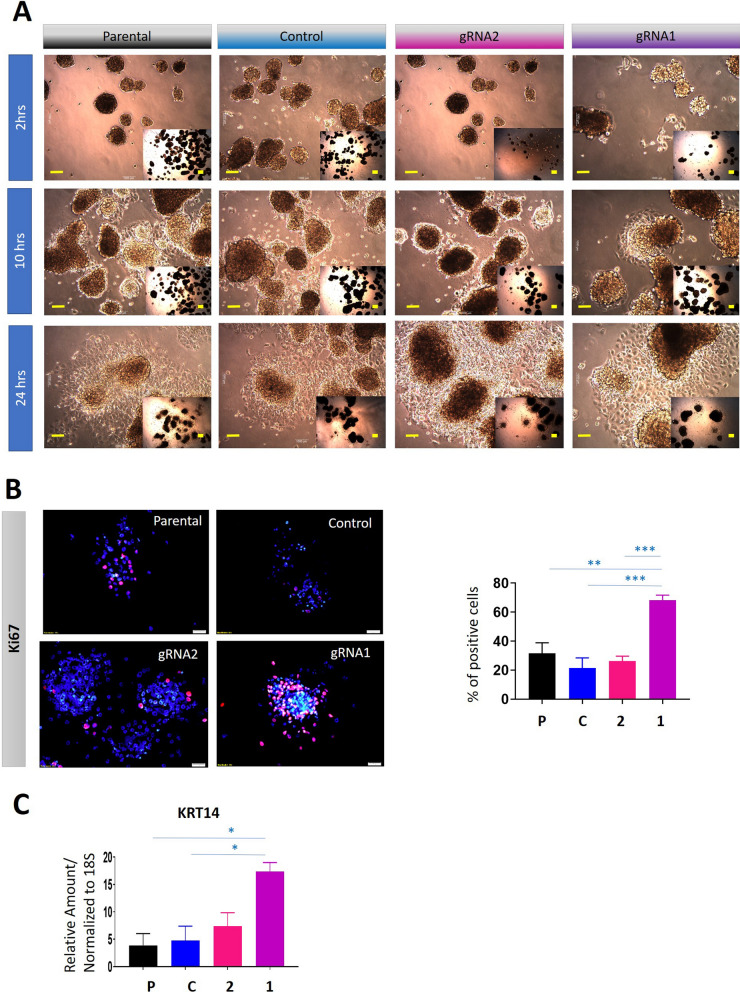
Fig. 9.
Reattachment of gRNA1 and gRNA2 cell-derived spheroids and their respective controls as monolayers; Ki67 proliferation and expression of KRT14 in reattached spheroid cells. The cells studied are described in this figure. A Spheroids of gRNA1 and gRNA2 cells were obtained by growth on low attachment plates. After day 10, spheroids were transferred to normal attachment plates and their attachment and spread as monolayer cultures were microscopically imaged at 2, 10 and 24 h. Scale bar (in yellow) 1000 µM. B Immunofluorescence of Ki67 stained cells was performed on Day 10 spheroids after 24 h of attachment as described in “Methods”. Images are representative of Ki-67 (red) and DAPI (blue) combined. ×20 magnification; scale bar (in white) 20 µM. Bar graphs represent mean ± SEM of 3 independent experiments. C mRNA expression of the invasive marker KRT14, evaluated by qRT-PCR in Day 10 spheroids after 24 h attachment as a monolayer. Values are mean ± SEM and the bar graph represents n = 3 independent experiments for each cell line spheroids collected. All Statistical significances were obtained using One-way ANOVA and are indicated by *p < 0.05, **p < 0.01, ***p < 0.001

