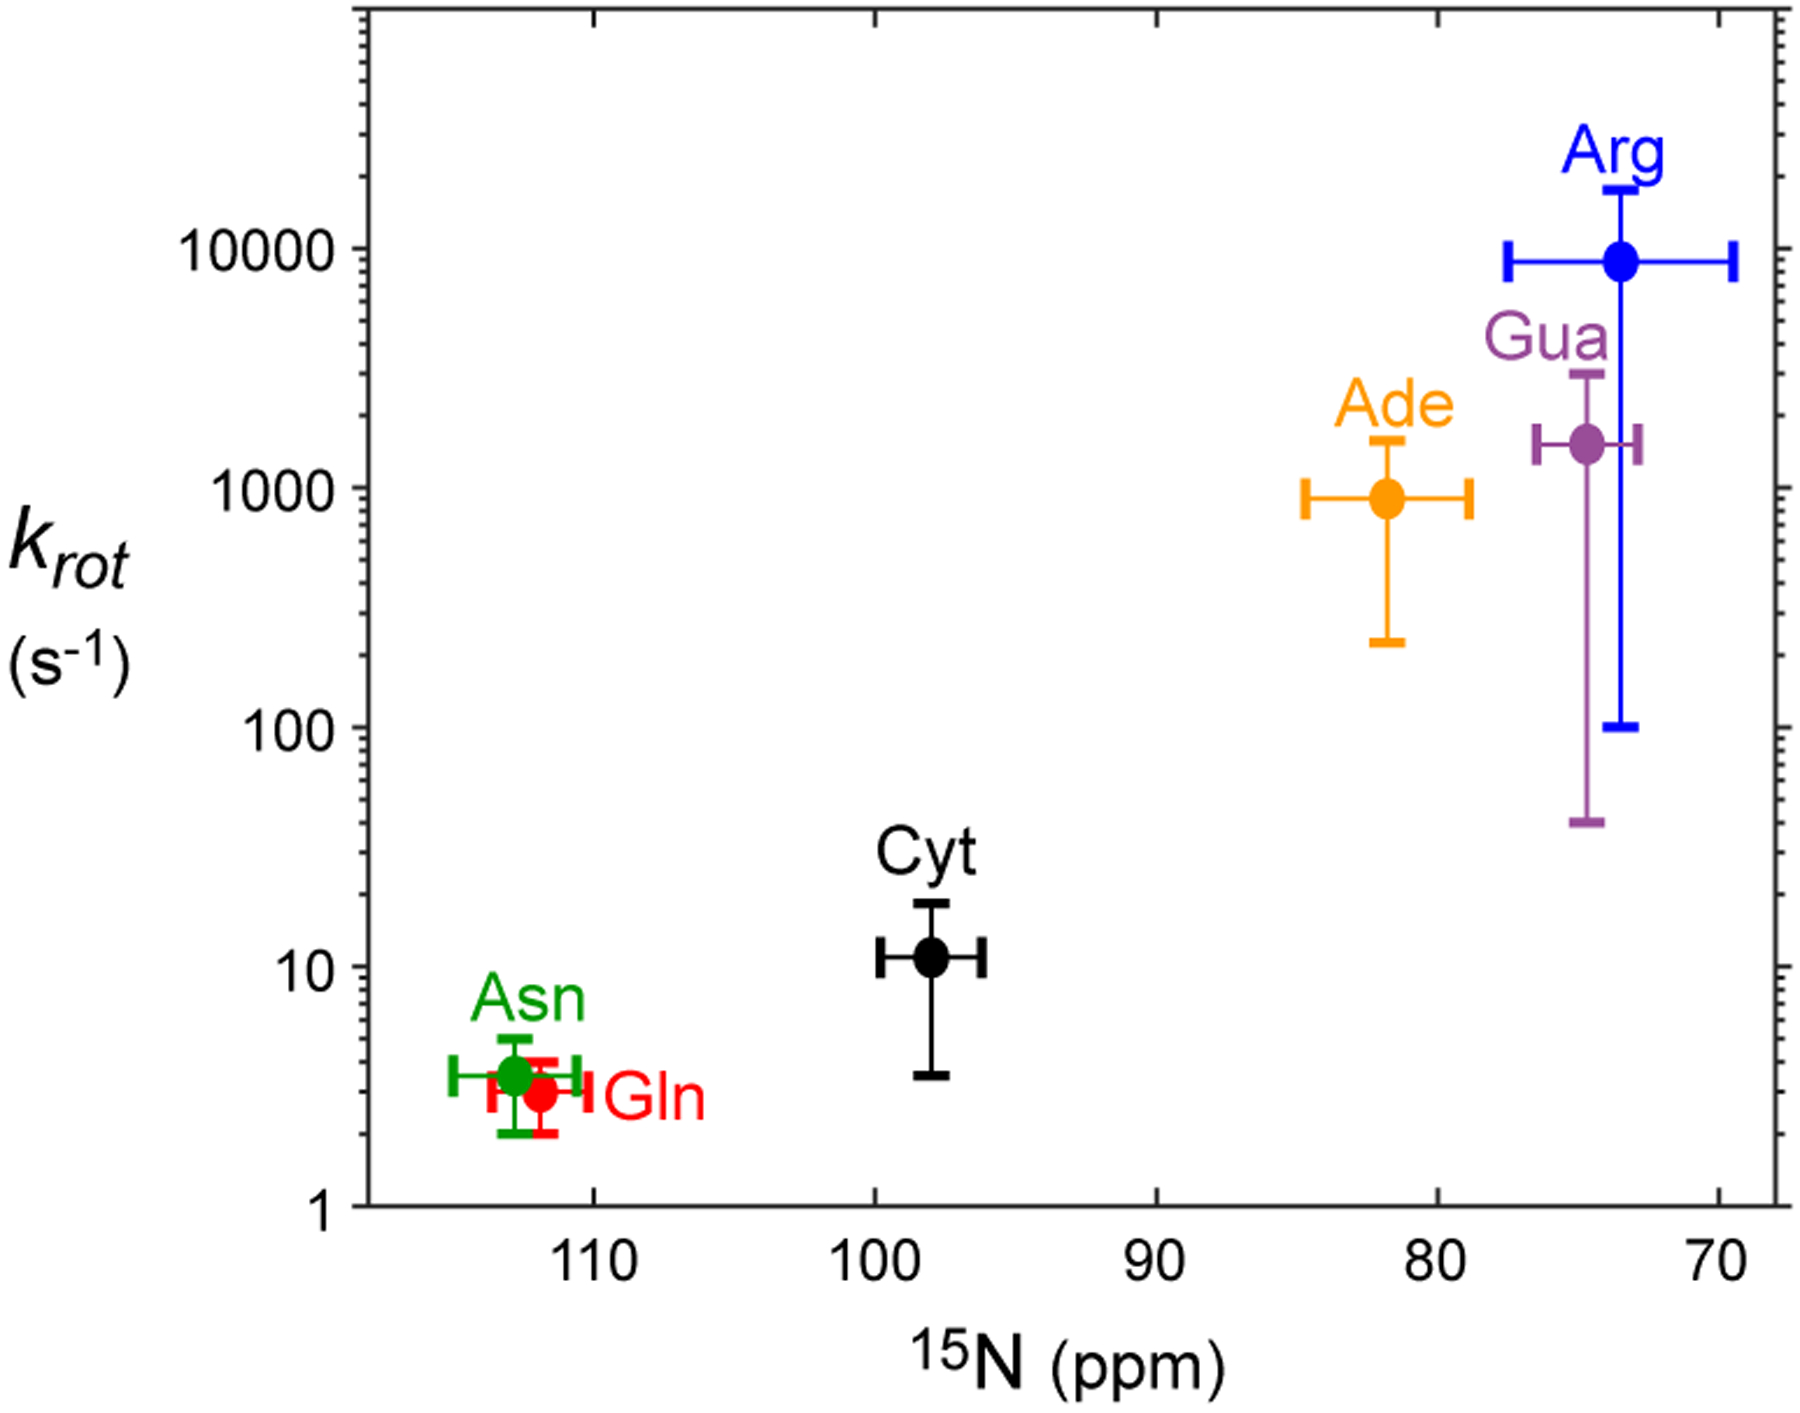
Figure 3.

Qualitative correlation between the ranges of 15N chemical shifts and rotation rate constants krot for biomolecular NH2 groups. The horizontal position and width of a cross represent the average and the standard deviation of 15N chemical shifts of each NH2 type in the Biological Magnetic Resonance Bank (BMRB) database. The vertical position and width represent a range of krot rate constants for Asp/Gln,13 Arg,23 cytosine (Cyt; current work), adenine (Ade),10 or guanine (Gua)9 NH2 groups at 25°C. Because of the limited information and factors that influence NH2 rotations (e.g., hydrogen bonds), the shown ranges of krot rate constants provide only qualitative information.
