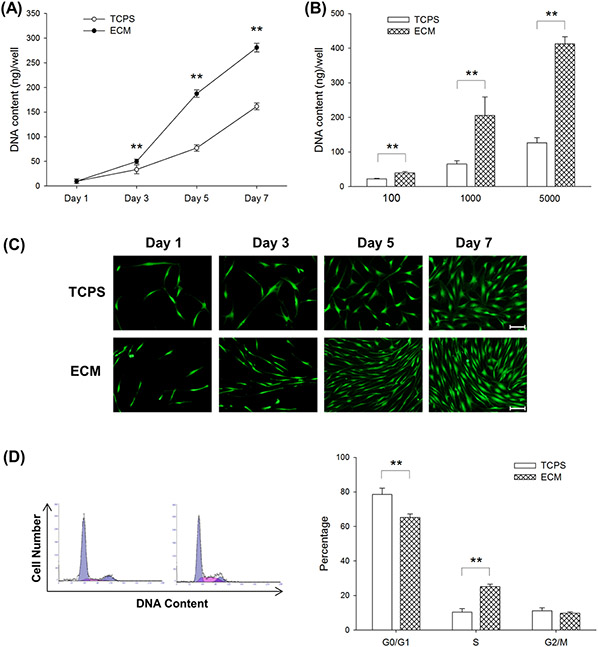
Fig.2.
Effects of culturing on ECM on cell proliferation and cell cycle phase distribution in UC-MSCs. (A) UC-MSCs were seeded on TCPS and ECM-coated surfaces at the cell density of 1,000 cells/cm2. The DNA content, representing cell proliferation, was assessed on days 3, 5, and 7. (B) UC-MSCs were seeded on TCPS and ECM at the cell density of 100, 1,000, and 5,000 cells/cm2. The DNA content was assessed on day 5. (C) Cell morphology and density were observed in representative fluorescence images labeled by fluorescein diacetate (FDA) when UC-MSCs were initially cultured at the cell density of 1,000 cells/cm2. Scale bar = 100 μm. (D) The cell cycle phase distribution of UC-MSCs cultured on TCPS and ECM was measured by flow cytometry analysis. Values are the mean ± S.E. of five independent experiments (n = 5) in the DNA content assay and of three independent experiments (n = 3) in the cell cycle phase distribution analysis. Statistically significant differences are indicated by ** (p < 0.01). TCPS: tissue culture polystyrene; ECM: extracellular matrix.

