
Figure 2.
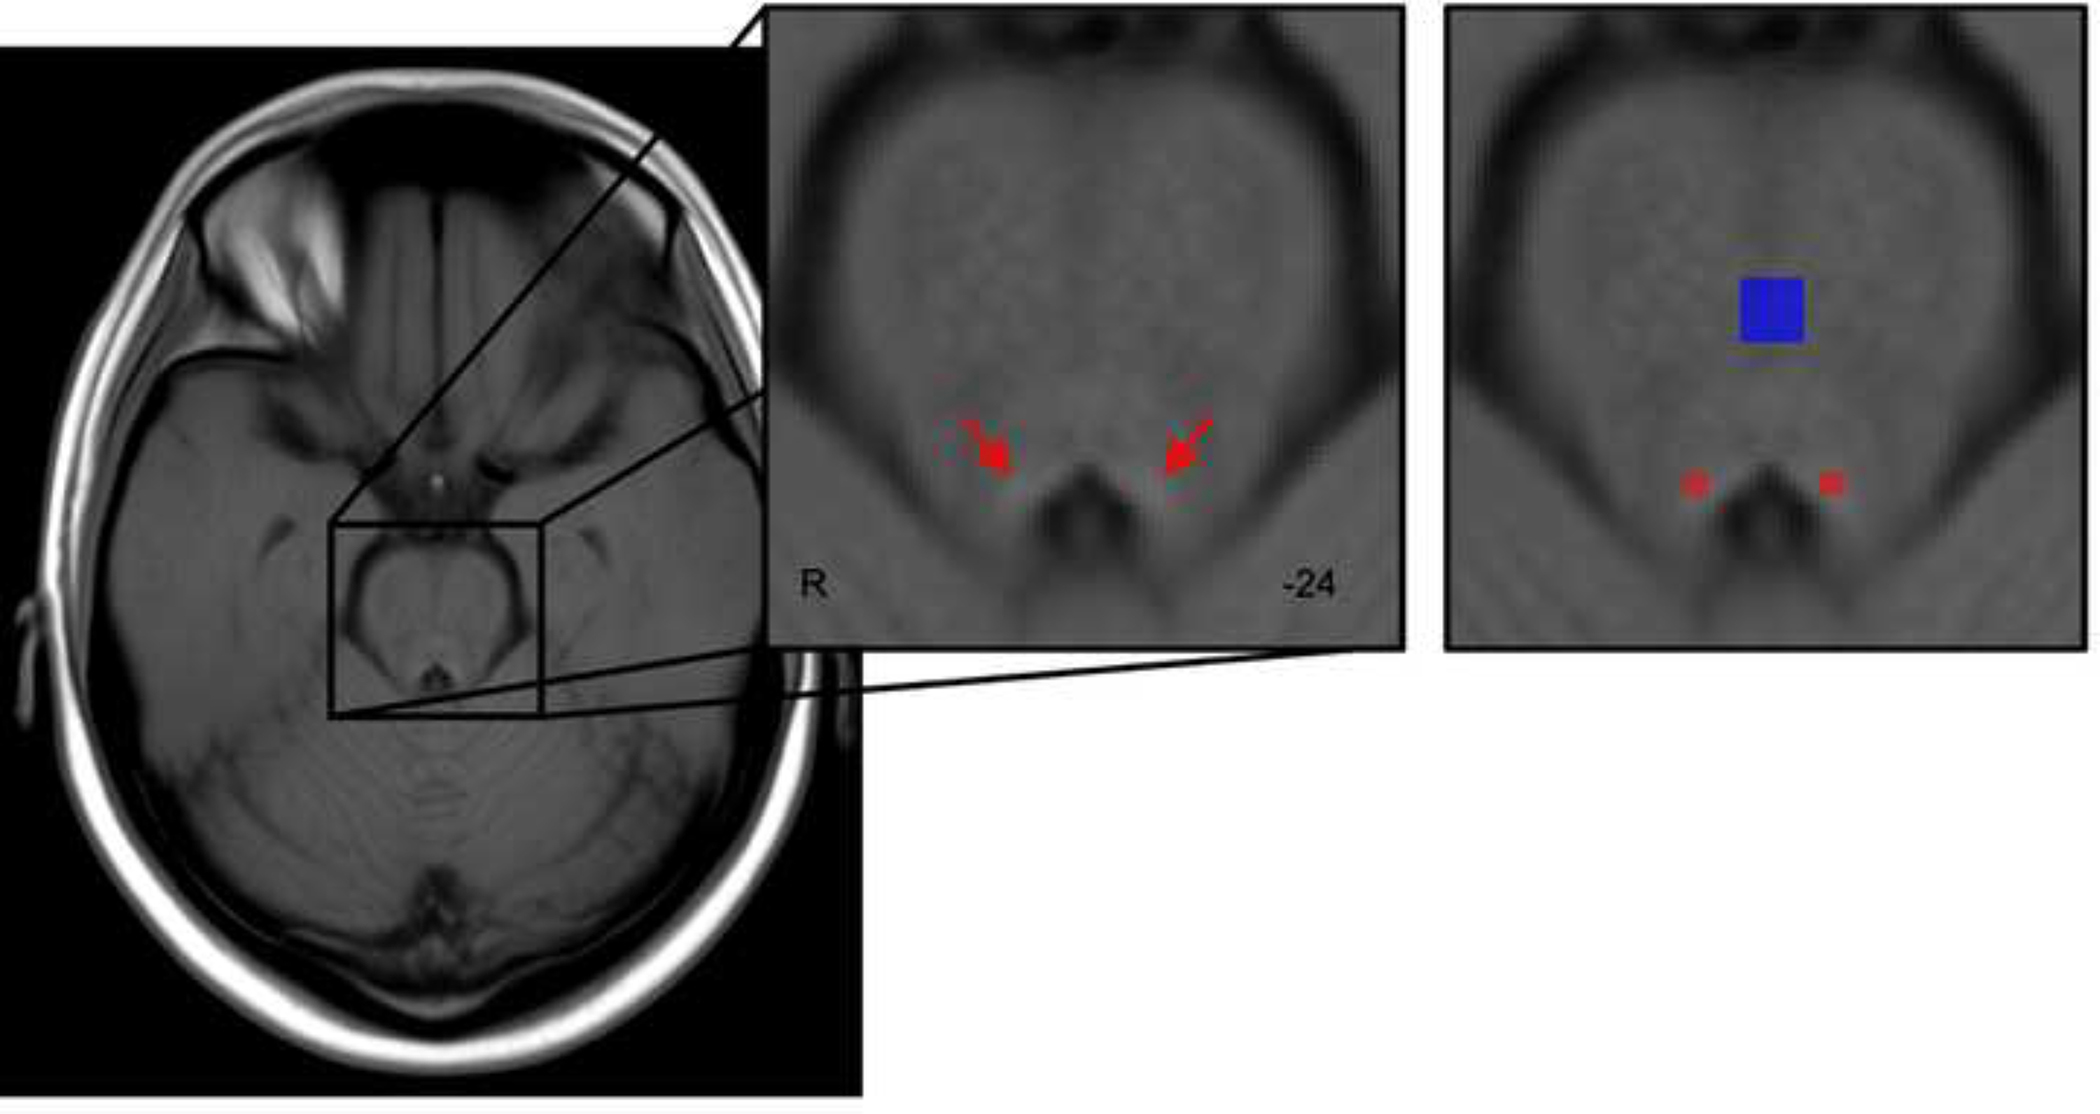
Template of all participants’ TSE scans, warped to MNI152 0.5mm linear space in the axial plane. Red arrows indicate hyperintensities bordering the fourth ventricle. For calculation of LC contrast ratios, a previously published LC map (Keren et al., 2009) was applied as a mask on individual TSE scans (shown in red) to identify probable voxels corresponding to the LC. In addition, a reference region covering the central pons (Dahl et al., 2020) was applied as a mask on individual TSE scans (shown in blue). Peak intensities within the masked LC and reference regions were extracted for each participant to calculate contrast ratios.